0
$\begingroup$

This question posed by @Cam is the closest I can find to my question but I feel that the answers don't really guide me in the way in which I'd like to proceed....

How do I dynamically change Manipulate controls?

Ultimately I'd like to be able to do this with Manipulate or Dynamic however for now I'd just be satisfied to get this working in a very manual way. If I can get it going manually then adding Dynamic will (hopefully) be the easy part.

I have a multivariate polynomial in (say) n variables but for simplification purposes let's call it 4 variables. I'd like to be able to use Plot3D to view the value of the function against two of the four variables but rather than specifying the variables explicitly, I'd like to be able to use some form of replacement rule to define which variables to plot against.

Conceptually speaking, I would like something like the following to work:

axes = {{w, 0, 20}, {x, -3, 3}, {y, -2, 2}, {z, -1, 1}};

w = 25;
x = -3;
y = -2;
z = 3;
Plot3D[Sin[w^(1/2) + x + y^2 + z^3], axes[[1]], axes[[3]]]

One of the important things here is that the axes variable contains both the variable to be plotted and its range.

Unless I'm mistaken, the responses in the post referenced above seemed to tackle a similar problem by substituting the variable names in the function to match the range specifications which I find confusing and hard to read, not to mention difficult to then sub in the correct ranges.

$\endgroup$

2 Answers 2

1
$\begingroup$

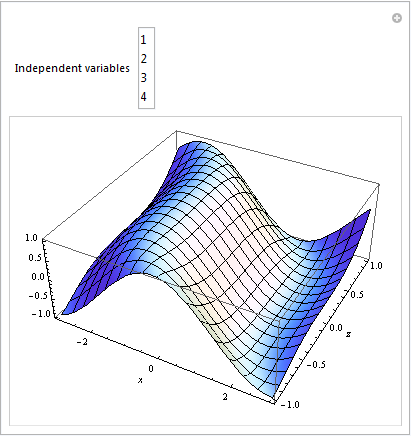
This could be a starting point : you select the two independent variables (with Ctlr) and then the function to be plotted and its ranges are updated. Finally all the information is passed to Plot3D.

You will have warnings if you change your choice of independent variables, but the plot will update.

    Manipulate[numValues = {w -> 25, x -> -3, y -> -2, z -> 3};
               axes = {{w, 0, 20}, {x, -3, 3}, {y, -2, 2}, {z, -1, 1}};
               vars = {w, x, y, z};
               func = Sin[w^(1/2) + x + y^2 + z^3] /. 
               numValues[[Complement[Range[4], ind]]];
               ranges = axes[[ind]];
               Plot3D @@ {func, ranges[[1]], ranges[[2]], AxesLabel -> vars[[ind]]}, 
               {{ind, {1, 2}, "Independent variables"}, ListPicker[#1, Range[4]] &}]

plot

$\endgroup$
1
  • $\begingroup$ Thanks b.gatessucks, that gives me all the critical elements I need to move forward. I will dissect the code to understand it a little better (I've not used Complement before). Just one minor item... you need to remove the superfluous comma just before the AxisLabel directive otherwise it throws an error. $\endgroup$ Commented Jan 22, 2014 at 22:42
0
$\begingroup$
Manipulate[Plot3D[Sin[w^(1/2) + x + y^2 + z^3],{w, 0, 20}, {x, -3, 3}], {y, -2, 2}, {z, -1, 1}]
$\endgroup$
1
  • $\begingroup$ Thanks santosh - I guess I didn't frame my question well enough for you to interpret what I was after. $\endgroup$ Commented Jan 22, 2014 at 22:39

Your Answer

By clicking “Post Your Answer”, you agree to our terms of service and acknowledge you have read our privacy policy.

Not the answer you're looking for? Browse other questions tagged or ask your own question.