7
$\begingroup$

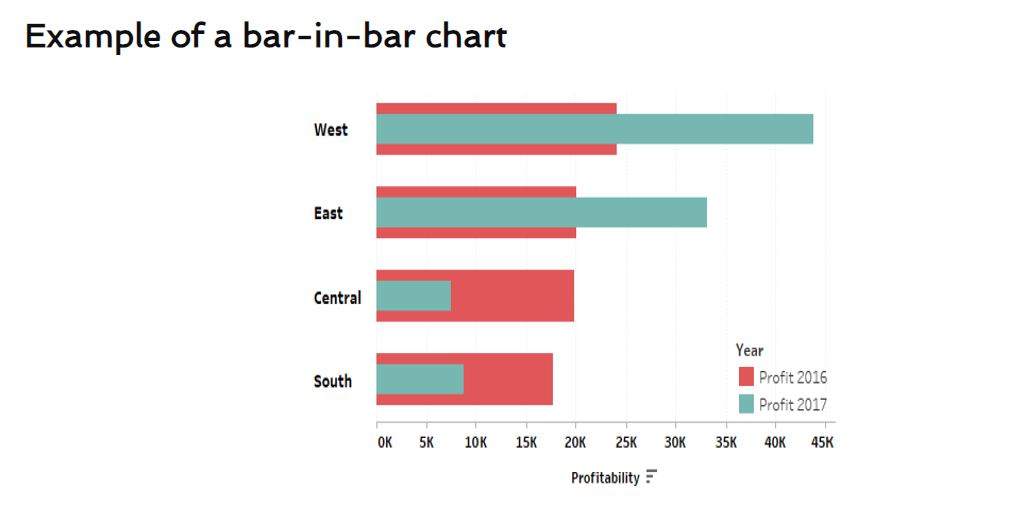
I would like to create a bar-in-bar chart similar to the online example provided below.

enter image description here

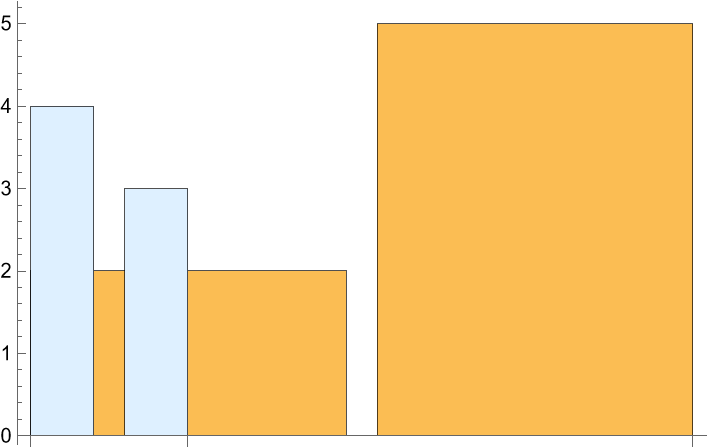
I have attempted to create it using the "RectangleChart" function to generate two bars. However, when I combine the two bars, the "Show" function produces a result with incorrect positioning, as shown here. Could you please guide me on how to resolve this alignment issue?

enter image description here

$\endgroup$
3
  • 2
    $\begingroup$ Please give us data to work with and include Mathematica code that you have tried so far. $\endgroup$
    – Syed
    Commented Sep 5, 2023 at 7:31
  • $\begingroup$ @Syed Thanks for your comment. This is a toy example for illustration of the problem. The admin has gave me a viable solution. Thanks! $\endgroup$
    – Frankie
    Commented Sep 5, 2023 at 9:25
  • $\begingroup$ In that case, let me try with some fake data. $\endgroup$
    – Syed
    Commented Sep 5, 2023 at 9:27

3 Answers 3

5
$\begingroup$
SeedRandom[1];
alist = RandomInteger[{20000, 45 10^3}, 4];
blist = RandomInteger[{20000, 45 10^3}, 4];

legend = SwatchLegend[{
    Opacity[1, Lighter@Red]
    , Opacity[1, Blend[{Lighter@Cyan, Gray}]]}
   , {"Profit 2016", "Profit 2017"}
   , LegendLabel -> Style["Year", Bold, 12]
   ];

b1 = BarChart[{{2, 1, 3}, {1, 3, 2}}, BarOrigin -> Left, 
   Ticks -> None, 
   ChartStyle -> {Lighter@Red, Blend[{Lighter@Cyan, Gray}]
     , Blend[{Lighter@Cyan, Gray}]}
   , BarSpacing -> {0.2, 0.5}
   , ImageSize -> 30
   ];

xlabel = Row[{"Profitability", "   ", b1}];    
    
xTicks = Transpose@{Range[0, 45000, 5000], 
        Table[ToString@i <> "k", {i, 0, 45, 5}]};

Legended[
 Show@MapThread[
   BarChart[
     #1
     , BarOrigin -> Left
     , BarSpacing -> #2
     , ChartStyle -> #3
     , Axes -> {True, True}
     , Ticks -> {True, None}
     , ChartLabels -> #4
     , PlotRangePadding -> 0.5
     , GridLines -> {Range[0, 45000, 5000], None}
     , GridLinesStyle -> {{Dotted, Gray}, None}
     , Frame -> {{False, False}, {True, False}}
     , FrameTicks -> {{None, None}, {xTicks, None}}
     , FrameLabel -> #5
     , ImageSize -> 500
     , PlotRange -> {{-10000, 50000}, Automatic}
     ] &,
   {{alist, blist}
    , {0.4, 1.4}
    , {Directive[EdgeForm[None], Opacity[1, Lighter@Red]]
     , Directive[EdgeForm[None], 
      Opacity[1, Blend[{Lighter@Cyan, Gray}]]]
     }
    , {None, 
     Style[# <> "      ", Bold, Black, 12, 
        FontFamily -> "Calibri"] & /@ {"South", "Central", "East", 
       "West"}}
    , {{None, xlabel}, None}
    }
   ]
 , Placed[legend, {0.9, 0.2}]
 ]
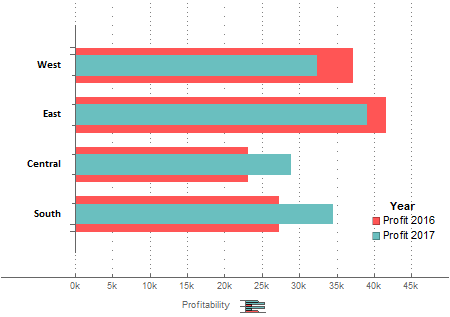
enter image description here

$\endgroup$
3
  • $\begingroup$ Many thanks again for your solution. I'm trying to learn from both solutions. Many thanks again! $\endgroup$
    – Frankie
    Commented Sep 5, 2023 at 9:56
  • $\begingroup$ Finally, I notice the key of this problem. The Barchart function works automatically with a centered position when overlapping two plots. We can use barspacing to control the width of the bars. However, I tried to use the RectangleChart function to generate a bar-in-bar chart, but it doesn't support the automatically centered function. $\endgroup$
    – Frankie
    Commented Sep 5, 2023 at 10:24
  • $\begingroup$ Mathematica has more mystery locks than users have keys for. I learn new stuff everyday. $\endgroup$
    – Syed
    Commented Sep 5, 2023 at 10:26
9
$\begingroup$
SeedRandom[1];
data = RandomInteger[{5, 40}, {10, 2}];

First, a helper function to pre-process input data to add metadata to be used for scaling bar widths:

preProcess = Map[Thread[# -> 1/Range[Length@#]/2] &];

and a custom ChartElementFunction that modifies the box coordinates using attached metadata:

cEF[cedf_ : "Rectangle"] := ChartElementData[cedf][{#[[1]], 
     Mean[#[[2]]] + {-1, 1} #3[[1]]}, ##2] &;

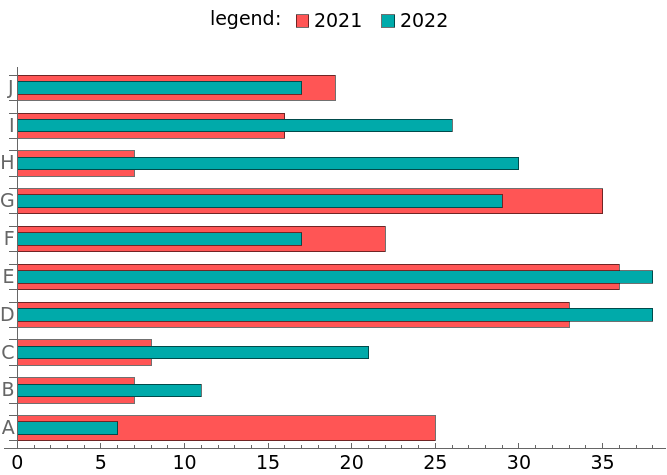
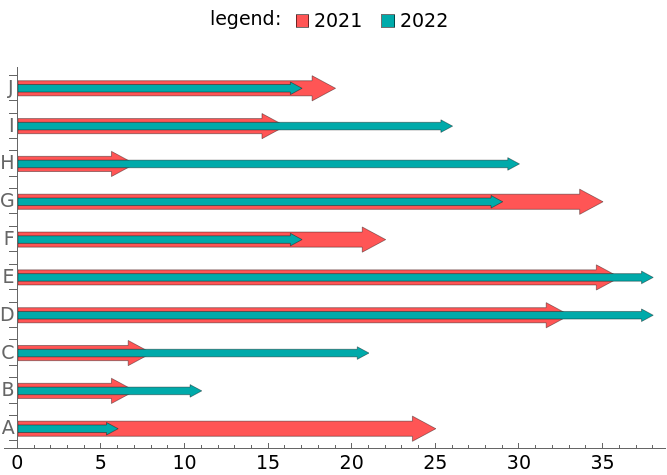
We can then use BarChart with the options BarSpacing, BarOrigin and the custom function cEF as the setting for the option ChartElementFunction

BarChart[preProcess @ data, 
 BarSpacing -> {-1, .5}, 
 BarOrigin -> Left, 
 ChartStyle -> {Lighter @ Red, Darker @ Cyan},
 ChartElementFunction -> cEF[], 
 ChartLabels -> {ToUpperCase@Alphabet[], None}, 
 ChartLegends -> 
  Placed[SwatchLegend[{"2021", "2022"}, 
    LegendLabel -> Placed["legend:", Before], LegendLayout -> "Row"], 
   Above], 
 LabelStyle -> 14,
 ImageSize -> 500]

enter image description here

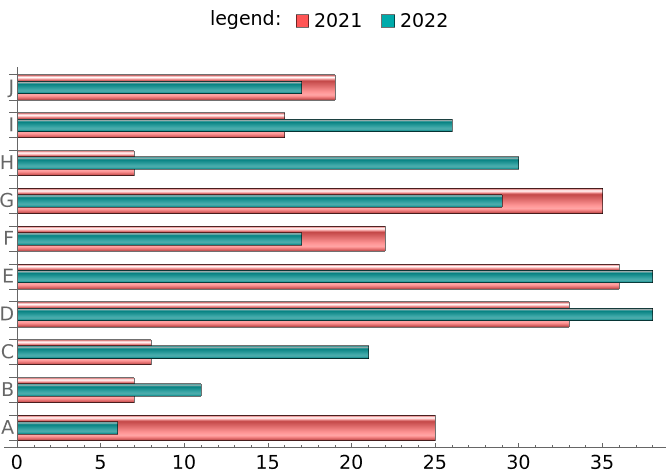
Use ChartElementFunction -> cEF["GlassRectangle"] to get

enter image description here

Use ChartElementFunction -> cEF["ArrowRectangle"] to get

enter image description here

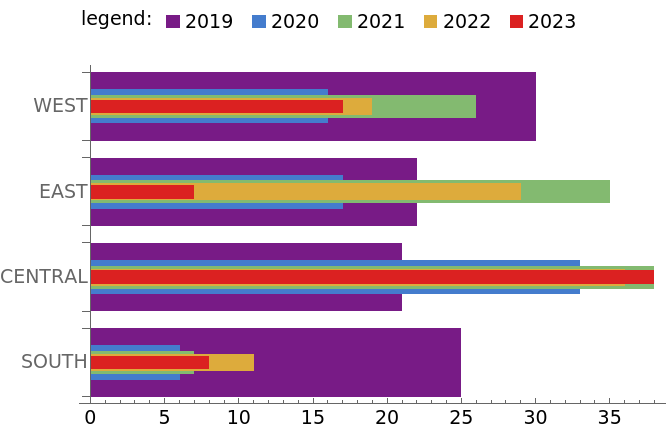
SeedRandom[1];
data2 = RandomInteger[{5, 40}, {4, 5}];

BarChart[preProcess @ data2,
  BarSpacing -> {-1, .25},
  BarOrigin -> Left,
  ChartStyle -> "Rainbow", 
  ChartElementFunction -> cEF[], 
  ChartBaseStyle -> EdgeForm[], 
  ChartLabels -> {{"SOUTH", "CENTRAL", "EAST", "WEST"}, None}, 
  ChartLegends -> 
    Placed[SwatchLegend[{"2019", "2020", "2021", "2022", "2023"}, 
      LegendLabel -> Placed["legend:", Before], 
      LegendLayout -> "Row"], Above], 
 LabelStyle -> 14, ImageSize -> 500]

enter image description here

$\endgroup$
1
  • $\begingroup$ Thanks again for your prompt response for my questions. The customized function works perfect for this issue. Thanks again kglr! $\endgroup$
    – Frankie
    Commented Sep 5, 2023 at 9:30
3
$\begingroup$

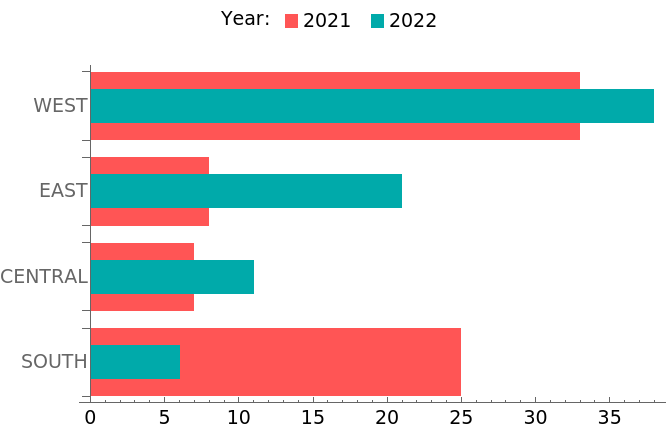
We can also use a custom DisplayFunction that post-processes BarChart output to rescale rectangle groups:

centerRectangleGroups = Replace[#, 
    p : {{_Directive, _[_[_Rectangle, ___], ___]} ..} :> 
     MapIndexed[Scale[#, {1, 1/#2[[1]]}] &, p], All] &;

Examples:

SeedRandom[1];

data = RandomInteger[{5, 40}, {4, 2}];

chartstyle = {Lighter @ Red, Darker @ Cyan};

legendlabels = Range[2021, 2022];

options = {
   DisplayFunction -> centerRectangleGroups,
   BarSpacing -> {-1, .25},
   BarOrigin -> Left,
   ChartStyle -> chartstyle,
   ChartBaseStyle -> EdgeForm[],
   ChartLabels -> {{"SOUTH", "CENTRAL", "EAST", "WEST"}, None},
   ChartLegends -> Placed[SwatchLegend[legendlabels,
      LegendLabel -> Placed["Year:", Before], LegendLayout -> "Row"], 
     Above],
   LabelStyle -> 14, ImageSize -> 500
   };


BarChart[data, options]

enter image description here

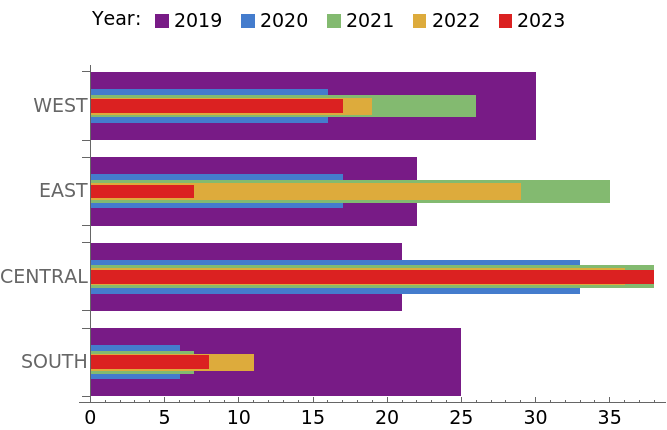
Replace data = RandomInteger[{5, 40}, {4, 2}]; with data = RandomInteger[{5, 40}, {4, 5}];, chartstyle = {Lighter@Red, Darker@Cyan}; with chartstyle = "Rainbow" and legendlabels = Range[2021, 2022]; with legendlabels = Range[2019, 2023]; above to get

enter image description here

$\endgroup$

Your Answer

By clicking “Post Your Answer”, you agree to our terms of service and acknowledge you have read our privacy policy.

Not the answer you're looking for? Browse other questions tagged or ask your own question.