added 2 characters in body
Source Link
kglr
  • 400.5k
  • 18
  • 488
  • 929
SeedRandom[1];
data = RandomInteger[{5, 40}, {10, 2}];

First, a helper function to pre-process input data to add metadata to be used for scaling bar widths:

preProcess = Map[Thread[# -> 1/Range[Length@#]/2] &];

and a custom ChartElementFunction that modifies the box coordinates using attached metadata:

cEF[cedf_ : "Rectangle"] := ChartElementData[cedf][{#[[1]], 
     Mean[#[[2]]] + {-1, 1} #3[[1]]}, ##2] &;

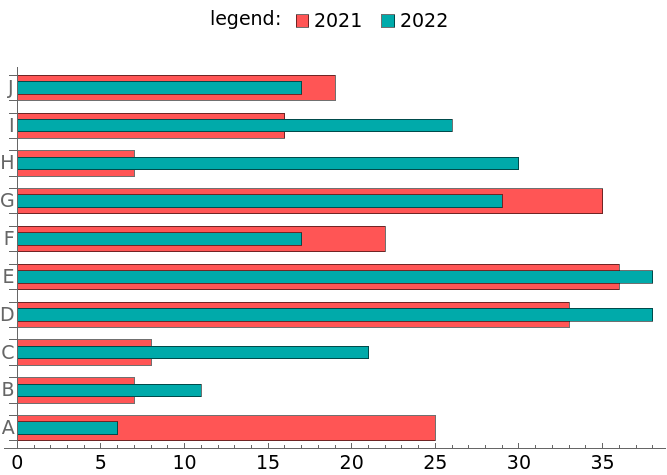
We can then use BarChart with the options BarSpacing, BarOrigin and the custom function cEF as the setting for the option ChartElementFunction

BarChart[preProcess @ data, 
 BarSpacing -> {-1, .5}, 
 BarOrigin -> Left, 
 ChartStyle -> {Lighter @ Red, Darker @ Cyan},
 ChartElementFunction -> cEF[], 
 ChartLabels -> {ToUpperCase@Alphabet[], None}, 
 ChartLegends -> 
  Placed[SwatchLegend[{"2021", "2022"}, 
    LegendLabel -> Placed["legend:", Before], LegendLayout -> "Row"], 
   Above], 
 LabelStyle -> 14,
 ImageSize -> 500]

enter image description here

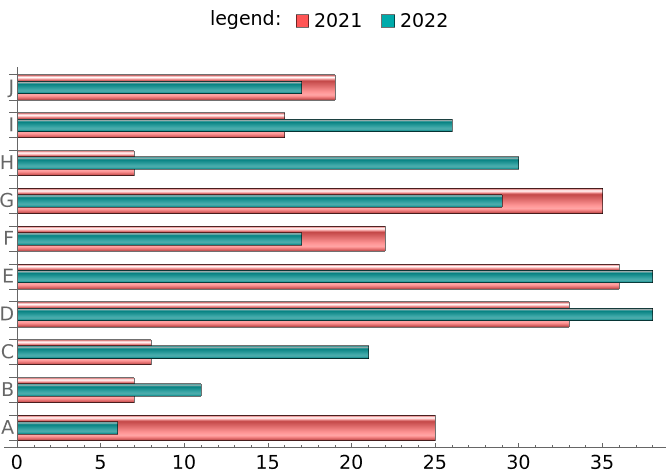
Use ChartElementFunction -> cEF["GlassRectangle"] to get

enter image description here

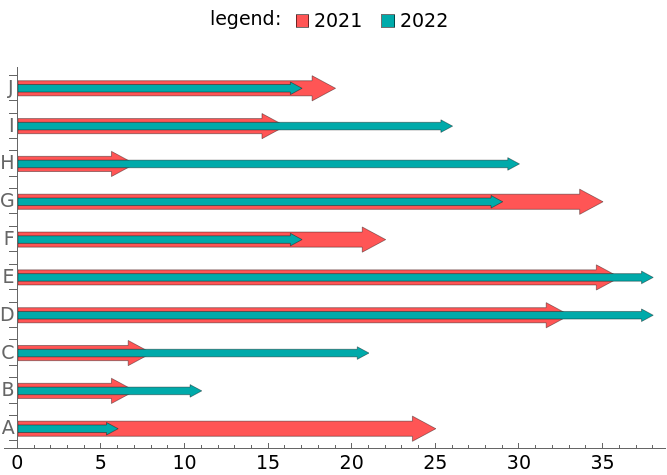
Use ChartElementFunction -> cEF["ArrowRectangle"] to get

enter image description here

SeedRandom[1];
data2 = RandomInteger[{5, 40}, {4, 5}];

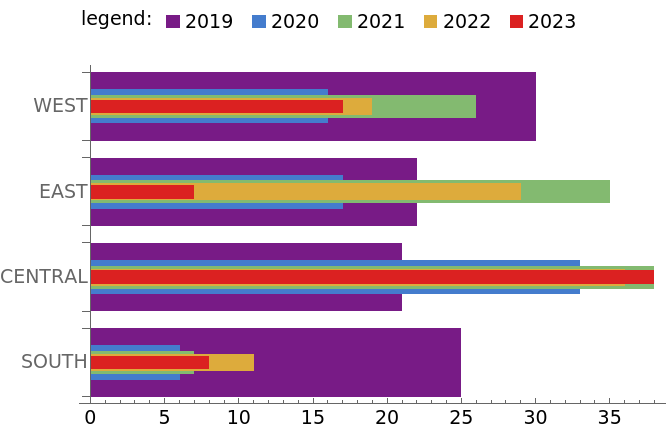
BarChart[preProcess @ data2,
  BarSpacing -> {-1, .25},
  BarOrigin -> Left,
  ChartStyle -> "Rainbow", 
  ChartElementFunction -> cEFcEF[], 
  ChartBaseStyle -> EdgeForm[], 
  ChartLabels -> {{"SOUTH", "CENTRAL", "EAST", "WEST"}, None}, 
  ChartLegends -> 
    Placed[SwatchLegend[{"2019", "2020", "2021", "2022", "2023"}, 
      LegendLabel -> Placed["legend:", Before], 
      LegendLayout -> "Row"], Above], 
 LabelStyle -> 14, ImageSize -> 500]
enter image description here

SeedRandom[1];
data = RandomInteger[{5, 40}, {10, 2}];

First, a helper function to pre-process input data to add metadata to be used for scaling bar widths:

preProcess = Map[Thread[# -> 1/Range[Length@#]/2] &];

and a custom ChartElementFunction that modifies the box coordinates using attached metadata:

cEF[cedf_ : "Rectangle"] := ChartElementData[cedf][{#[[1]], 
     Mean[#[[2]]] + {-1, 1} #3[[1]]}, ##2] &;

We can then use BarChart with the options BarSpacing, BarOrigin and the custom function cEF as the setting for the option ChartElementFunction

BarChart[preProcess @ data, 
 BarSpacing -> {-1, .5}, 
 BarOrigin -> Left, 
 ChartStyle -> {Lighter @ Red, Darker @ Cyan},
 ChartElementFunction -> cEF[], 
 ChartLabels -> {ToUpperCase@Alphabet[], None}, 
 ChartLegends -> 
  Placed[SwatchLegend[{"2021", "2022"}, 
    LegendLabel -> Placed["legend:", Before], LegendLayout -> "Row"], 
   Above], 
 LabelStyle -> 14,
 ImageSize -> 500]
enter image description here

Use ChartElementFunction -> cEF["GlassRectangle"] to get

enter image description here

Use ChartElementFunction -> cEF["ArrowRectangle"] to get

enter image description here

SeedRandom[1];
data2 = RandomInteger[{5, 40}, {4, 5}];

BarChart[preProcess @ data2,
  BarSpacing -> {-1, .25},
  BarOrigin -> Left,
  ChartStyle -> "Rainbow", 
  ChartElementFunction -> cEF, 
  ChartBaseStyle -> EdgeForm[], 
  ChartLabels -> {{"SOUTH", "CENTRAL", "EAST", "WEST"}, None}, 
  ChartLegends -> 
    Placed[SwatchLegend[{"2019", "2020", "2021", "2022", "2023"}, 
      LegendLabel -> Placed["legend:", Before], 
      LegendLayout -> "Row"], Above], 
 LabelStyle -> 14, ImageSize -> 500]
enter image description here

SeedRandom[1];
data = RandomInteger[{5, 40}, {10, 2}];

First, a helper function to pre-process input data to add metadata to be used for scaling bar widths:

preProcess = Map[Thread[# -> 1/Range[Length@#]/2] &];

and a custom ChartElementFunction that modifies the box coordinates using attached metadata:

cEF[cedf_ : "Rectangle"] := ChartElementData[cedf][{#[[1]], 
     Mean[#[[2]]] + {-1, 1} #3[[1]]}, ##2] &;

We can then use BarChart with the options BarSpacing, BarOrigin and the custom function cEF as the setting for the option ChartElementFunction

BarChart[preProcess @ data, 
 BarSpacing -> {-1, .5}, 
 BarOrigin -> Left, 
 ChartStyle -> {Lighter @ Red, Darker @ Cyan},
 ChartElementFunction -> cEF[], 
 ChartLabels -> {ToUpperCase@Alphabet[], None}, 
 ChartLegends -> 
  Placed[SwatchLegend[{"2021", "2022"}, 
    LegendLabel -> Placed["legend:", Before], LegendLayout -> "Row"], 
   Above], 
 LabelStyle -> 14,
 ImageSize -> 500]
enter image description here

Use ChartElementFunction -> cEF["GlassRectangle"] to get

enter image description here

Use ChartElementFunction -> cEF["ArrowRectangle"] to get

enter image description here

SeedRandom[1];
data2 = RandomInteger[{5, 40}, {4, 5}];

BarChart[preProcess @ data2,
  BarSpacing -> {-1, .25},
  BarOrigin -> Left,
  ChartStyle -> "Rainbow", 
  ChartElementFunction -> cEF[], 
  ChartBaseStyle -> EdgeForm[], 
  ChartLabels -> {{"SOUTH", "CENTRAL", "EAST", "WEST"}, None}, 
  ChartLegends -> 
    Placed[SwatchLegend[{"2019", "2020", "2021", "2022", "2023"}, 
      LegendLabel -> Placed["legend:", Before], 
      LegendLayout -> "Row"], Above], 
 LabelStyle -> 14, ImageSize -> 500]

enter image description here

added 322 characters in body
Source Link
kglr
  • 400.5k
  • 18
  • 488
  • 929
SeedRandom[1];
data = RandomInteger[{5, 40}, {10, 2}];

First, a helper function to pre-process input data to add metadata to be used for scaling bar widths:

preProcess = Map[Thread[# -> 1/Range[Length@#]/2] &];

and a custom ChartElementFunction that modifies the box coordinates using attached metadata:

cEFcEF[cedf_ : "Rectangle"] := ChartElementData["Rectangle"][ChartElementData[cedf][{#[[1]], 
     Mean[#[[2]]] + {-1, 1} #3[[1]]}, ##2] &;

We can then use BarChart with the options BarSpacing, BarOrigin and the custom function cEF as the setting for the option ChartElementFunction

BarChart[preProcess @ data, 
 BarSpacing -> {-1, .5}, 
 BarOrigin -> Left, 
 ChartStyle -> {OrangeLighter @ Red, Darker@GreenDarker @ Cyan}, 
 ChartElementFunction -> cEFcEF[], 
 ChartLabels -> {ToUpperCase@Alphabet[], None}, 
 ChartLegends -> 
  Placed[SwatchLegend[{"2021", "2022"}, 
    LegendLabel -> Placed["legend:", Before], LegendLayout -> "Row"], 
   Above], 
 LabelStyle -> 14,
 ImageSize -> 500]

enter image description hereenter image description here

Use ChartElementFunction -> cEF["GlassRectangle"] to get

enter image description here

Use ChartElementFunction -> cEF["ArrowRectangle"] to get

enter image description here

SeedRandom[1];
data2 = RandomInteger[{5, 40}, {4, 5}];

BarChart[preProcess @ data2,
  BarSpacing -> {-1, .25},
  BarOrigin -> Left,
  ChartStyle -> "Rainbow", 
  ChartElementFunction -> cEF, 
  ChartBaseStyle -> EdgeForm[], 
  ChartLabels -> {{"SOUTH", "CENTRAL", "EAST", "WEST"}, None}, 
  ChartLegends -> 
    Placed[SwatchLegend[{"2019", "2020", "2021", "2022", "2023"}, 
      LegendLabel -> Placed["legend:", Before], 
      LegendLayout -> "Row"], Above], 
 LabelStyle -> 14, ImageSize -> 500]

enter image description here

SeedRandom[1];
data = RandomInteger[{5, 40}, {10, 2}];

First, a helper function to pre-process input data to add metadata to be used for scaling bar widths:

preProcess = Map[Thread[# -> 1/Range[Length@#]/2] &];

and a custom ChartElementFunction that modifies the box coordinates using attached metadata:

cEF = ChartElementData["Rectangle"][{#[[1]], 
     Mean[#[[2]]] + {-1, 1} #3[[1]]}, ##2] &;

We can then use BarChart with the options BarSpacing, BarOrigin and the custom function cEF as the setting for the option ChartElementFunction

BarChart[preProcess @ data, 
 BarSpacing -> {-1, .5}, 
 BarOrigin -> Left, 
 ChartStyle -> {Orange, Darker@Green}, 
 ChartElementFunction -> cEF, 
 ChartLabels -> {ToUpperCase@Alphabet[], None}, 
 ChartLegends -> 
  Placed[SwatchLegend[{"2021", "2022"}, 
    LegendLabel -> Placed["legend:", Before], LegendLayout -> "Row"], 
   Above], 
 LabelStyle -> 14,
 ImageSize -> 500]

enter image description here

SeedRandom[1];
data2 = RandomInteger[{5, 40}, {4, 5}];

BarChart[preProcess @ data2,
  BarSpacing -> {-1, .25},
  BarOrigin -> Left,
  ChartStyle -> "Rainbow", 
  ChartElementFunction -> cEF, 
  ChartBaseStyle -> EdgeForm[], 
  ChartLabels -> {{"SOUTH", "CENTRAL", "EAST", "WEST"}, None}, 
  ChartLegends -> 
    Placed[SwatchLegend[{"2019", "2020", "2021", "2022", "2023"}, 
      LegendLabel -> Placed["legend:", Before], 
      LegendLayout -> "Row"], Above], 
 LabelStyle -> 14, ImageSize -> 500]

enter image description here

SeedRandom[1];
data = RandomInteger[{5, 40}, {10, 2}];

First, a helper function to pre-process input data to add metadata to be used for scaling bar widths:

preProcess = Map[Thread[# -> 1/Range[Length@#]/2] &];

and a custom ChartElementFunction that modifies the box coordinates using attached metadata:

cEF[cedf_ : "Rectangle"] := ChartElementData[cedf][{#[[1]], 
     Mean[#[[2]]] + {-1, 1} #3[[1]]}, ##2] &;

We can then use BarChart with the options BarSpacing, BarOrigin and the custom function cEF as the setting for the option ChartElementFunction

BarChart[preProcess @ data, 
 BarSpacing -> {-1, .5}, 
 BarOrigin -> Left, 
 ChartStyle -> {Lighter @ Red, Darker @ Cyan},
 ChartElementFunction -> cEF[], 
 ChartLabels -> {ToUpperCase@Alphabet[], None}, 
 ChartLegends -> 
  Placed[SwatchLegend[{"2021", "2022"}, 
    LegendLabel -> Placed["legend:", Before], LegendLayout -> "Row"], 
   Above], 
 LabelStyle -> 14,
 ImageSize -> 500]

enter image description here

Use ChartElementFunction -> cEF["GlassRectangle"] to get

enter image description here

Use ChartElementFunction -> cEF["ArrowRectangle"] to get

enter image description here

SeedRandom[1];
data2 = RandomInteger[{5, 40}, {4, 5}];

BarChart[preProcess @ data2,
  BarSpacing -> {-1, .25},
  BarOrigin -> Left,
  ChartStyle -> "Rainbow", 
  ChartElementFunction -> cEF, 
  ChartBaseStyle -> EdgeForm[], 
  ChartLabels -> {{"SOUTH", "CENTRAL", "EAST", "WEST"}, None}, 
  ChartLegends -> 
    Placed[SwatchLegend[{"2019", "2020", "2021", "2022", "2023"}, 
      LegendLabel -> Placed["legend:", Before], 
      LegendLayout -> "Row"], Above], 
 LabelStyle -> 14, ImageSize -> 500]

enter image description here

added 666 characters in body
Source Link
kglr
  • 400.5k
  • 18
  • 488
  • 929
SeedRandom[1];
data = RandomInteger[{5, 40}, {10, 2}];

First, a helper function to pre-process input data to add metadata to be used for scaling bar widths:

preProcess = Map[Thread[# -> 1/(Range@Length@#)]Range[Length@#]/2] &];

and a custom ChartElementFunction that modifies the box coordinates using attached metadata:

cEF = ChartElementData["Rectangle"][{#[[1]], 
     Mean[#[[2]]] + {-1, 1} #3[[1]]/2}, ##2] &;

We can then use BarChart with the options BarSpacing, BarOrigin and the custom function cEF as the setting for the option ChartElementFunction

BarChart[preProcess @ data, 
 BarSpacing -> {-1, .5}, 
 BarOrigin -> Left, 
 ChartStyle -> {Orange, Darker@Green}, 
 ChartElementFunction -> cEF, 
 ChartLabels -> {ToUpperCase@Alphabet[], None}, 
 ChartLegends -> 
  Placed[SwatchLegend[{"2021", "2022"}, 
    LegendLabel -> Placed["legend:", Before], LegendLayout -> "Row"], 
   Above], 
 LabelStyle -> 14,
 ImageSize -> 500]

enter image description here

SeedRandom[1];
data2 = RandomInteger[{5, 40}, {4, 5}];

BarChart[preProcess @ data2,
  BarSpacing -> {-1, .25},
  BarOrigin -> Left,
  ChartStyle -> "Rainbow", 
  ChartElementFunction -> cEF, 
  ChartBaseStyle -> EdgeForm[], 
  ChartLabels -> {{"SOUTH", "CENTRAL", "EAST", "WEST"}, None}, 
  ChartLegends -> 
    Placed[SwatchLegend[{"2019", "2020", "2021", "2022", "2023"}, 
      LegendLabel -> Placed["legend:", Before], 
      LegendLayout -> "Row"], Above], 
 LabelStyle -> 14, ImageSize -> 500]

enter image description here

SeedRandom[1];
data = RandomInteger[{5, 40}, {10, 2}];

First, a helper function to pre-process input data to add metadata to be used for scaling bar widths:

preProcess = Map[Thread[# -> 1/(Range@Length@#)] &];

and a custom ChartElementFunction that modifies the box coordinates using attached metadata:

cEF = ChartElementData["Rectangle"][{#[[1]], 
     Mean[#[[2]]] + {-1, 1} #3[[1]]/2}, ##2] &;

We can then use BarChart with the options BarSpacing, BarOrigin and the custom function cEF as the setting for the option ChartElementFunction

BarChart[preProcess @ data, 
 BarSpacing -> {-1, .5}, 
 BarOrigin -> Left, 
 ChartStyle -> {Orange, Darker@Green}, 
 ChartElementFunction -> cEF, 
 ChartLabels -> {ToUpperCase@Alphabet[], None}, 
 ChartLegends -> 
  Placed[SwatchLegend[{"2021", "2022"}, 
    LegendLabel -> Placed["legend:", Before], LegendLayout -> "Row"], 
   Above], 
 LabelStyle -> 14,
 ImageSize -> 500]

enter image description here

SeedRandom[1];
data = RandomInteger[{5, 40}, {10, 2}];

First, a helper function to pre-process input data to add metadata to be used for scaling bar widths:

preProcess = Map[Thread[# -> 1/Range[Length@#]/2] &];

and a custom ChartElementFunction that modifies the box coordinates using attached metadata:

cEF = ChartElementData["Rectangle"][{#[[1]], 
     Mean[#[[2]]] + {-1, 1} #3[[1]]}, ##2] &;

We can then use BarChart with the options BarSpacing, BarOrigin and the custom function cEF as the setting for the option ChartElementFunction

BarChart[preProcess @ data, 
 BarSpacing -> {-1, .5}, 
 BarOrigin -> Left, 
 ChartStyle -> {Orange, Darker@Green}, 
 ChartElementFunction -> cEF, 
 ChartLabels -> {ToUpperCase@Alphabet[], None}, 
 ChartLegends -> 
  Placed[SwatchLegend[{"2021", "2022"}, 
    LegendLabel -> Placed["legend:", Before], LegendLayout -> "Row"], 
   Above], 
 LabelStyle -> 14,
 ImageSize -> 500]

enter image description here

SeedRandom[1];
data2 = RandomInteger[{5, 40}, {4, 5}];

BarChart[preProcess @ data2,
  BarSpacing -> {-1, .25},
  BarOrigin -> Left,
  ChartStyle -> "Rainbow", 
  ChartElementFunction -> cEF, 
  ChartBaseStyle -> EdgeForm[], 
  ChartLabels -> {{"SOUTH", "CENTRAL", "EAST", "WEST"}, None}, 
  ChartLegends -> 
    Placed[SwatchLegend[{"2019", "2020", "2021", "2022", "2023"}, 
      LegendLabel -> Placed["legend:", Before], 
      LegendLayout -> "Row"], Above], 
 LabelStyle -> 14, ImageSize -> 500]

enter image description here

added 245 characters in body
Source Link
kglr
  • 400.5k
  • 18
  • 488
  • 929
Loading
Source Link
kglr
  • 400.5k
  • 18
  • 488
  • 929
Loading