2
$\begingroup$

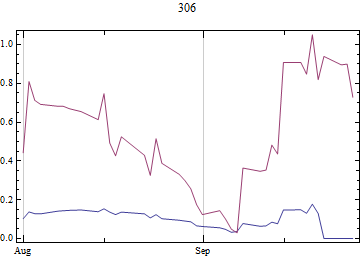
What I would like to do is generate a chart similar to the TradingChart but to have two lines on it instead of the candlestick.

The lines I want to plot will look something like this;
enter image description here

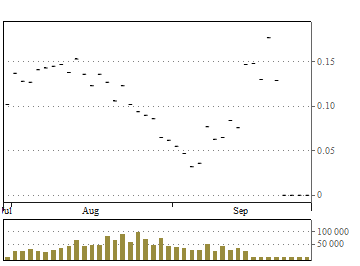
And what I want to do is replace the top plot on this chart;
enter image description here

The idea is to have the two lines on the DateListPlot with the trading volume bar chart below.

By question is am I better off setting up a GraphicsColumn with a DateListPlot and a BarChart or can I modify the TradingChart to get it to do what I want? I'd prefer to modify the TradignChart because it's got some nice interactive content which I don't know how to do myself.

$\endgroup$
1
  • $\begingroup$ Where are those 2 lines? - are they some sort of indicators, like Bollinger bands or Moving average envelopes? Also could you please give your code. $\endgroup$ Commented Feb 13, 2013 at 5:13

1 Answer 1

5
$\begingroup$

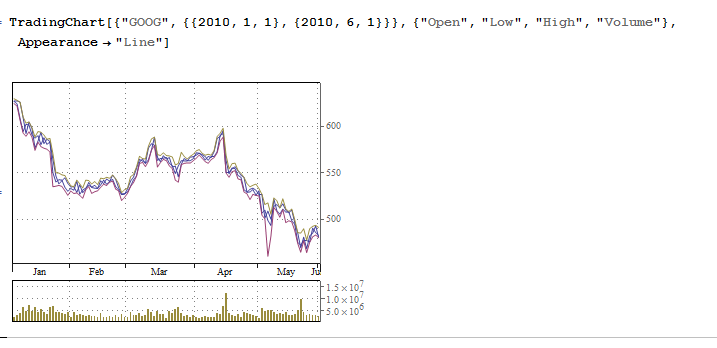
Appearance->"Line" option setting gives line graphs:

 TradingChart[{"GOOG", {{2010, 1, 1}, {2010, 6, 1}}}, {"Open", "Low", 
  "High", "Volume"}, Appearance -> "Line"]

enter image description here

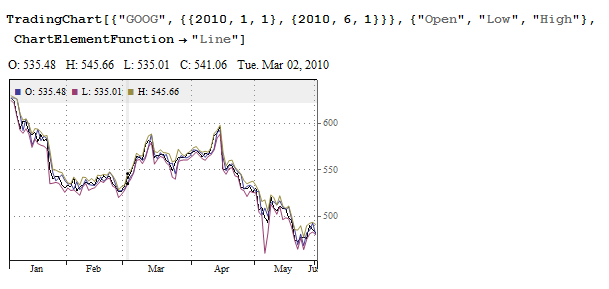
You can also use ChartElementFunction->"Line":

 TradingChart[{"GOOG", {{2010, 1, 1}, {2010, 6, 1}}}, {"Open", "Low", "High"},
 ChartElementFunction -> "Line"]

enter image description here

By the way, this setting does not appear in the list of functions in ChartElementData["TradingChart"]:

 ChartElementData["TradingChart"]
 (* {"ArrowCandlestick", "Candlestick", "FadingCandlestick",  "FadingOHLC", 
   "GlassCandlestick", "HLC", "OHLC"}*)

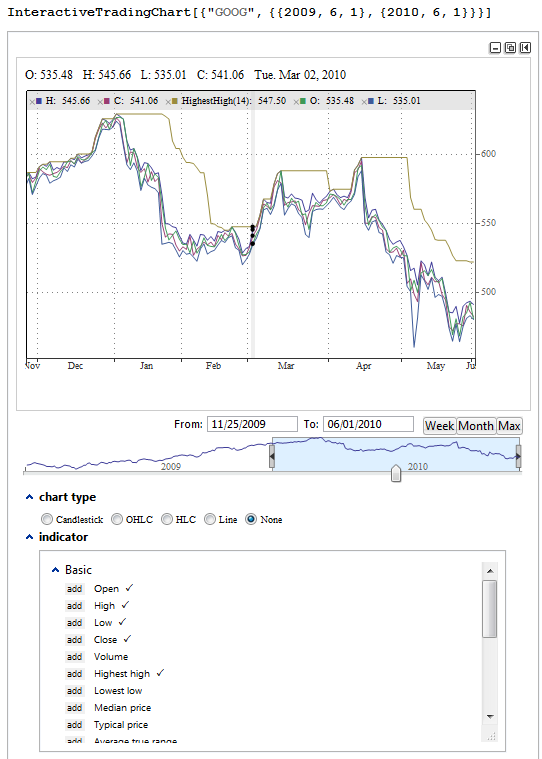
With InteractiveTradingChart, selecting the option None or the option Line for ChartType produces line graphs of selected indicators:

 InteractiveTradingChart[{"GOOG", {{2009, 6, 1}, {2010, 6, 1}}}]

enter image description here

$\endgroup$
4
  • $\begingroup$ Thanks for that, the Appearance->"Line" option looks like what I want. One small point is that I'd like to replace the Open/Low/High tags with something like Close/Model_1/Model_2. It seems you can do something like this with the InteractiveTradingChart but you can only select from their list of indicators. $\endgroup$
    – Cam
    Commented Feb 13, 2013 at 6:26
  • $\begingroup$ Cam, as far as i can tell it is impossible to make such tweaks in the InteractiveTradingChart by playing with the documented options. BTW, that would make a really good new question. Perhaps some spelunking to identify what to Replace/ReplaceAll and by post-processing to make the appropriate replacement might work. Better yet, someone from Wolfram may suggest methods/tricks to do this kind of customization. $\endgroup$
    – kglr
    Commented Feb 13, 2013 at 7:12
  • $\begingroup$ Thanks kguler, I think you've answered this question. I'll email Wolfram and see if I get anything. What I want to be able to do is compare different option pricing models to the closing spot price for the options itself. It may be something Wolfram would be interested in. $\endgroup$
    – Cam
    Commented Feb 13, 2013 at 22:06
  • $\begingroup$ @Cam, Thank you for the accept. Actually, you have two great questions: (1) how to change the legends displayed on mouseover, ie, replace "O:","H:" ... by "mylabel1",..., and (2) how to use your custom-built finanical indicator function in TradingChart. For both, it would be great if you can post the question and the response from Wolfram. $\endgroup$
    – kglr
    Commented Feb 13, 2013 at 22:25

Your Answer

By clicking “Post Your Answer”, you agree to our terms of service and acknowledge you have read our privacy policy.

Not the answer you're looking for? Browse other questions tagged or ask your own question.