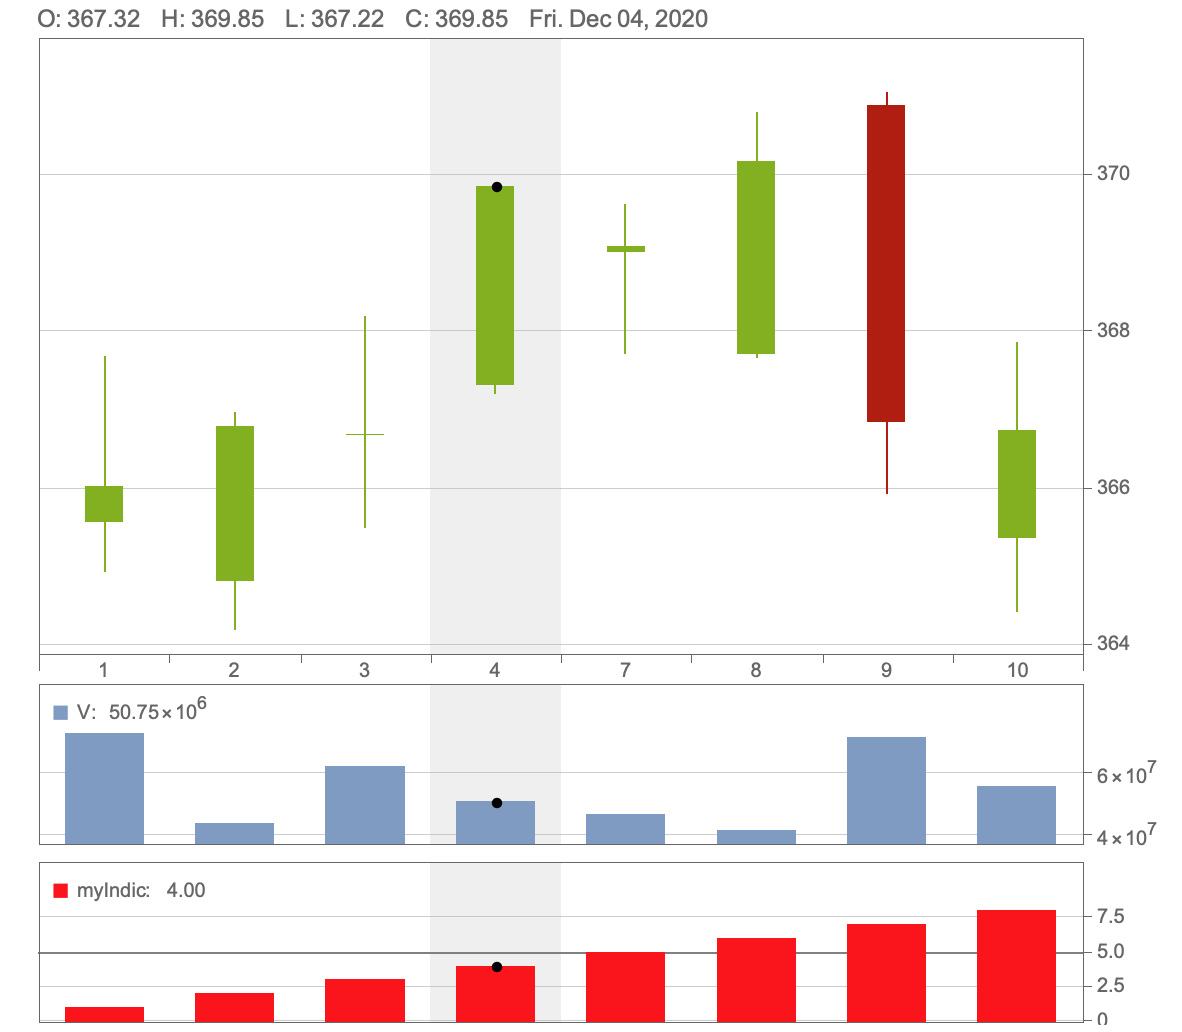
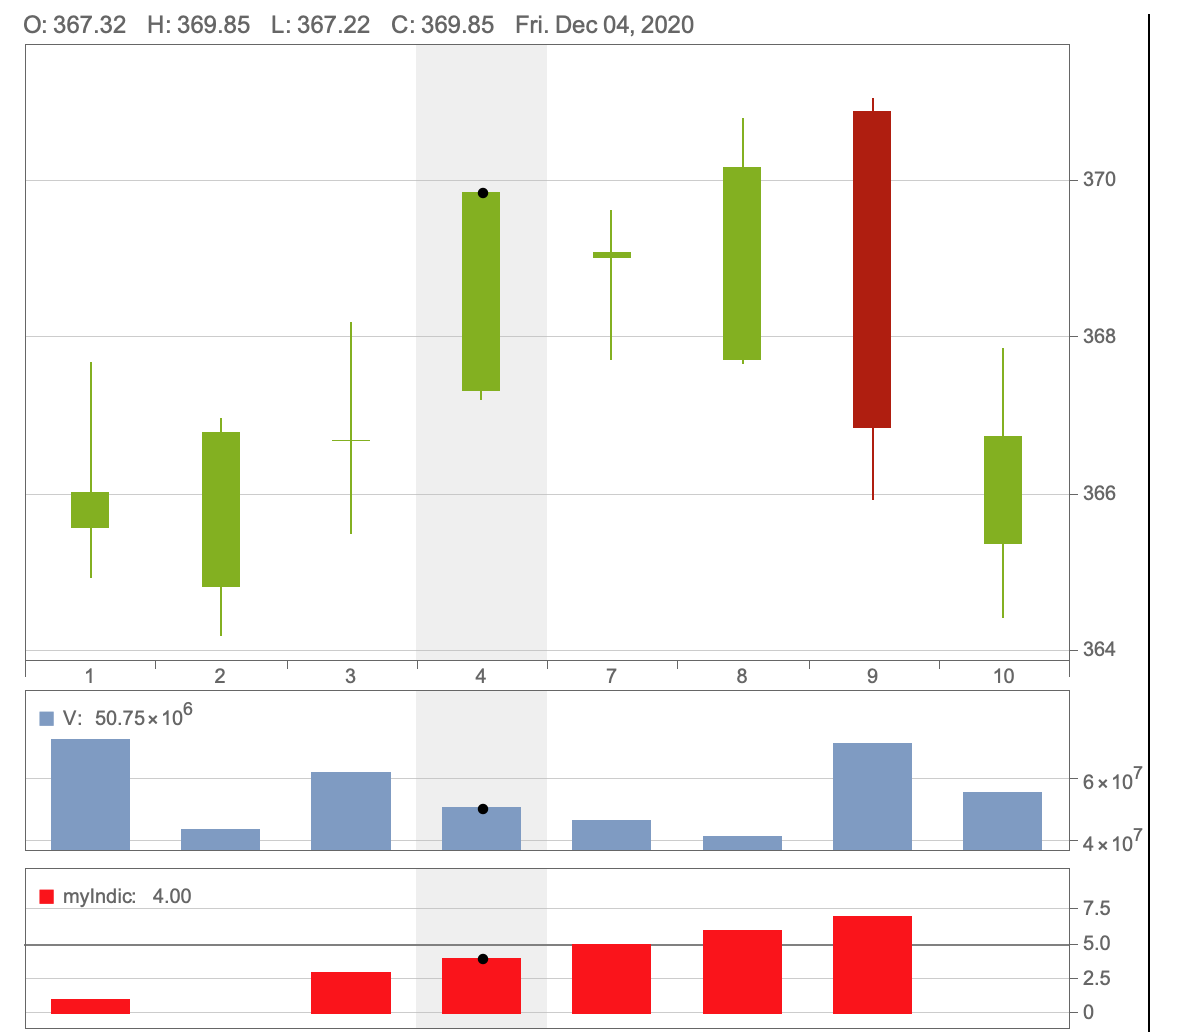
I plot a trading chart by using TradingChart for early December data:
spy = FinancialData["SPY", "OHLCV", {{2020, 12, 1}, {2020, 12, 10}}];
TradingChart[spy, {"Volume"}]
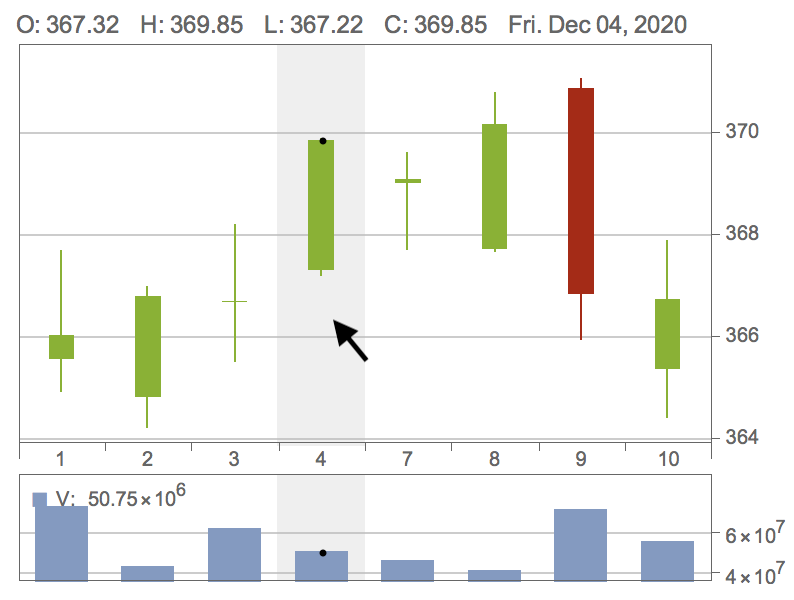
This gives a nice chart:
Note that when I put my cursor on each chart-bar, the volume indicator plotted below the chart also displays the corresponding value.
Now, suppose I already have a data set associated with date:
indicatorData =
  {{{2020, 12, 1}, 1}, {{2020, 12, 2}, 2}, {{2020, 12, 3}, 3},
   {{2020, 12, 4}, 4}, {{2020, 12, 7}, 5}, {{2020, 12, 8},6},
   {{2020, 12, 9}, 7}, {{2020, 12, 10}, 8}}
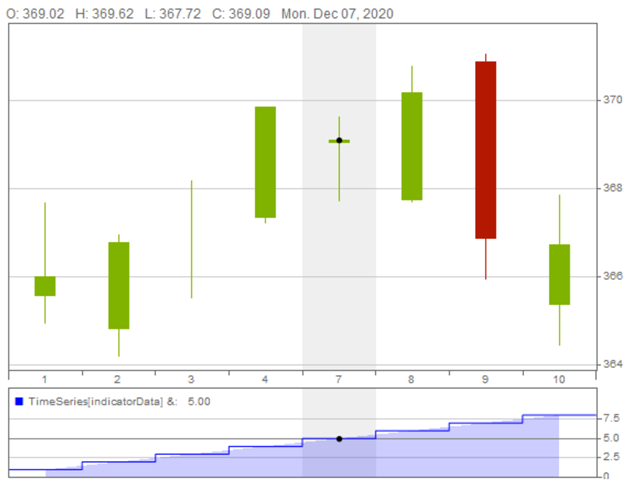
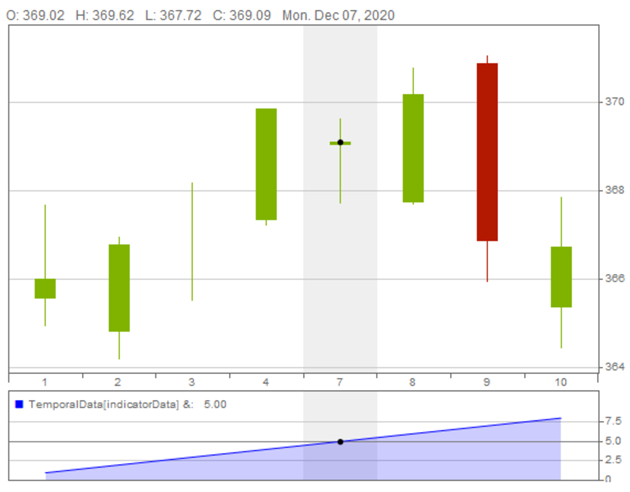
I want to plot my indicatorData just below the trading chart with the same horizontal axis, exactly like the Volume indicator is plotted in the above image, so that the corresponding value of my indicator is displayed when the cursor is positioned on a chart-bar.
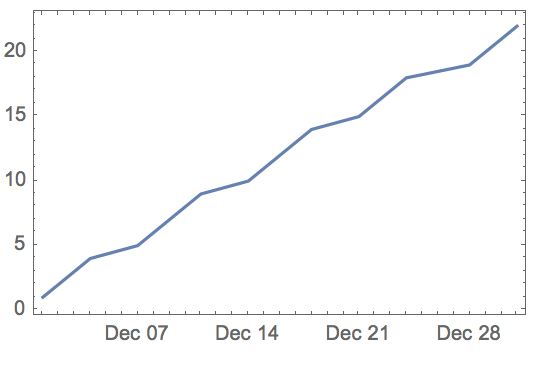
DateListPlot of my financial indicator is
I notice that my question is closely related to this question, where an original FinancialIndicator, using a complicated equation, is introduced.
But, my situation is slightly different. I already have numerical data in indicatorData. I do not need to calculate any values using equations.
I only need to plot my data below the trading chart with appropriate behavior of the cursor.
I want to use my indicator exactly like Volume, SimpleMovingAverage, BolingerBands, etc. embedded in FinancialIndicator.
Updated question
I update my question by receiving an answer to the original question.
The dates of my actual data set (which is much longer than the example data set of indicatorData) is not equal to the dates of SPY financial data.
For simplicity, say, my actual data is like
actualData = {{{2020, 12, 1}, 1}, {{2020, 12, 3}, 3}, {{2020, 12, 4}, 4},
{{2020, 12, 7}, 5}, {{2020, 12, 8},6}, {{2020, 12, 9}, 7}}
As you can see, datas for {2020,12,3} and {2020,12,10} are missing in the actual data compared to the example indicatorData.
In this case, an elegant answer by kglr does not work.
I want to plot my indicator corresponding to the date appropriately.

