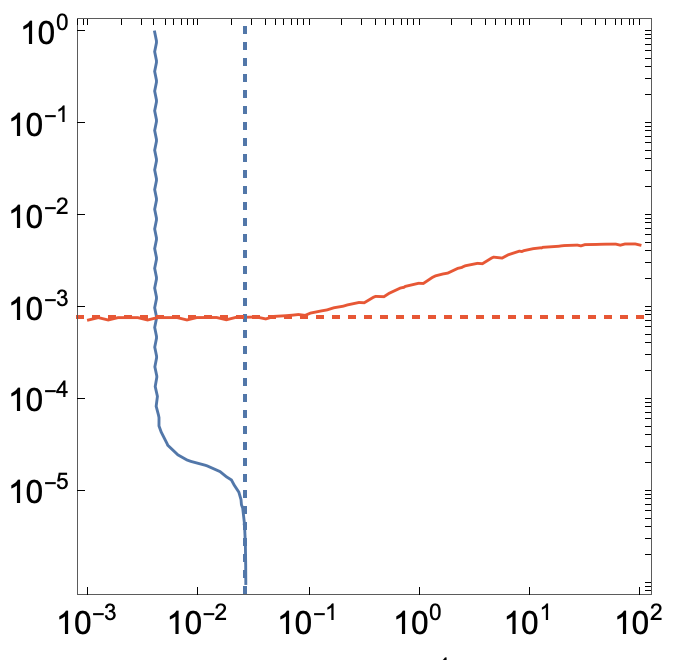
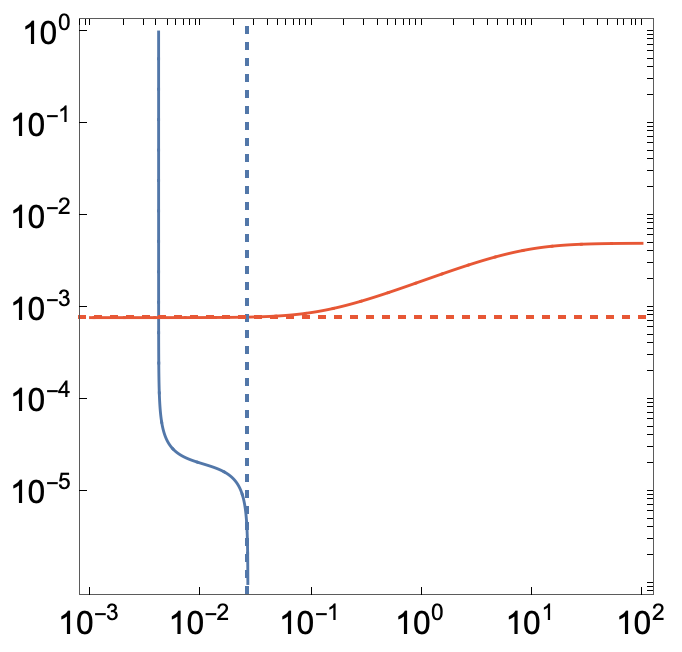
I have been using ContourPlot for a complicated but analytic function, which does not need numerical calculations. I am confused to see the result looks like the following picture, where the lines which should be straight are wavy. Is here some problems with the plot steps or anything else?
The code is about
ContourPlot[f[a,b,x,y]==f[a,b,g[a],0],{gae, 10^-3, 100}, {gag, 10^-6, 1},
ScalingFunctions -> {"Log", "Log"}]
where f is an analytic but complicated function of variables a, b, x, y, while g[a] is a interpolation function of variable a. Moreover, in my plot variables a and b are fixed.


PlotPoints -> 300(or more)? $\endgroup$f, people probably won't be able to help as effectively! :) $\endgroup$