3
$\begingroup$

I have read some similar equations in other places, but it seems like theirs suggestions does not work in my case.

I would like to plot a complex equation in complex plane by the ContourPlot, the equation is ${\rm Re}[f(z)]=0$, where $f(z)=\sqrt{-1-z^2}-\arctan\left(\sqrt{-1-z^2}\right)$. The @Mathematica gives the following picture: It is obvious that there is a missing contour, connecting $\pm i$. Currently I have a dirty solution to this problem, i.e., replacing the original function by $i g(z)=i\sqrt{1+z^2}-i\text{ArcTanh}\left(\sqrt{1+z^2}\right)$. Instead, now I am going to plot ${\rm Im}[g(z)]=0$. It works, there is no missing any longer, see the following picture But in general it can not always modify the functions, such that ${\rm Re}[f(z)]=0$ becomes ${\rm Im}[g(z)]=0$.
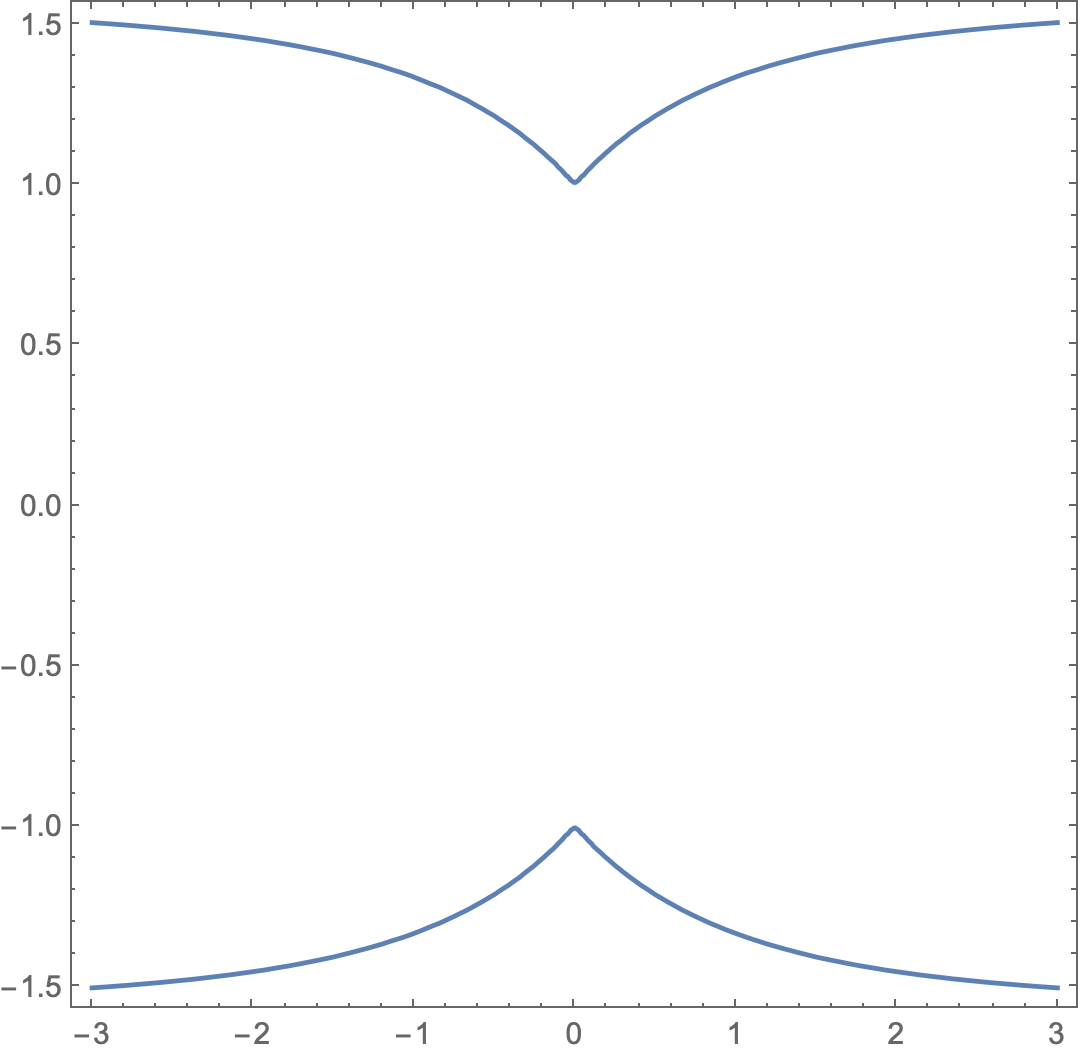
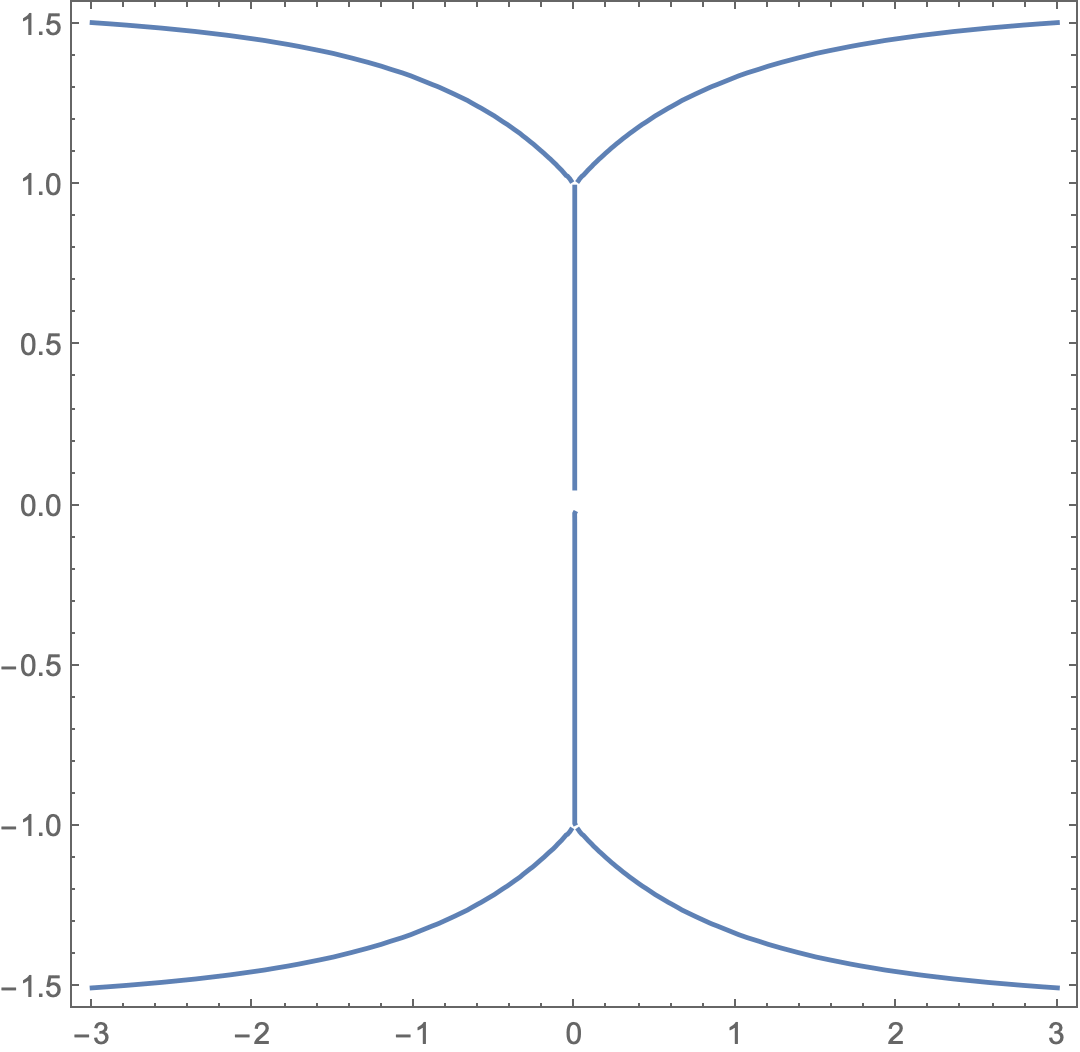
My questions are:

  1. What's wrong with ContourPlot in this case?
  2. How can I solve this problem by a universal method?

Thanks in advance!

$\endgroup$
1
  • 1
    $\begingroup$ Welcome to Mathematica.SE! I hope you will become a regular contributor. To get started, 1) take the introductory tour now, 2) when you see good questions and answers, vote them up by clicking the gray triangles, because the credibility of the system is based on the reputation gained by users sharing their knowledge, 3) remember to accept the answer, if any, that solves your problem, by clicking the checkmark sign, and 4) give help too, by answering questions in your areas of expertise. $\endgroup$
    – bbgodfrey
    Commented Oct 30, 2020 at 13:33

1 Answer 1

2
$\begingroup$

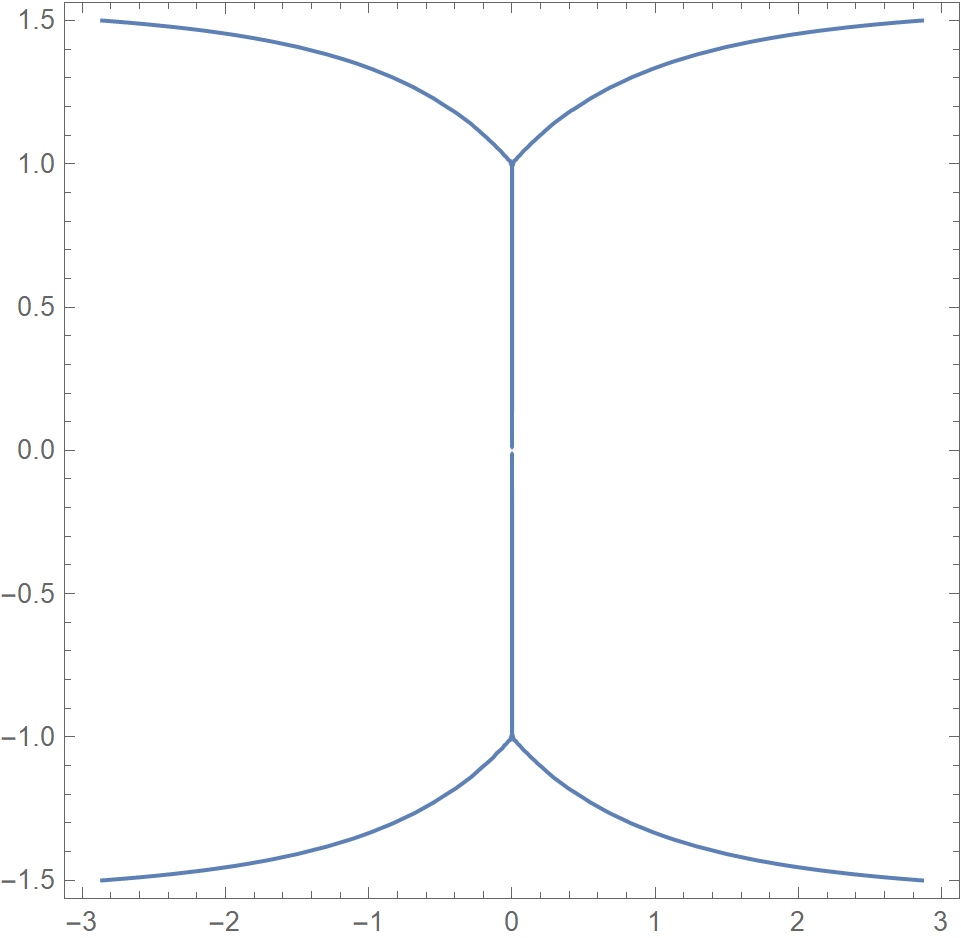
The problem appears to be that the missing line segment lies on a branch cut. This issue can be circumvented by moving the contour slightly off the branch cut and excluding none of the plot.

f[z] := Sqrt[-1 - z^2] - ArcTan[Sqrt[-1 - z^2]]
ComplexContourPlot[Re[f[z]] == -10^-4, {z, -3 - 3/2 I, 3 + 3/2 I}, Exclusions -> None]

enter image description here

Response to comment

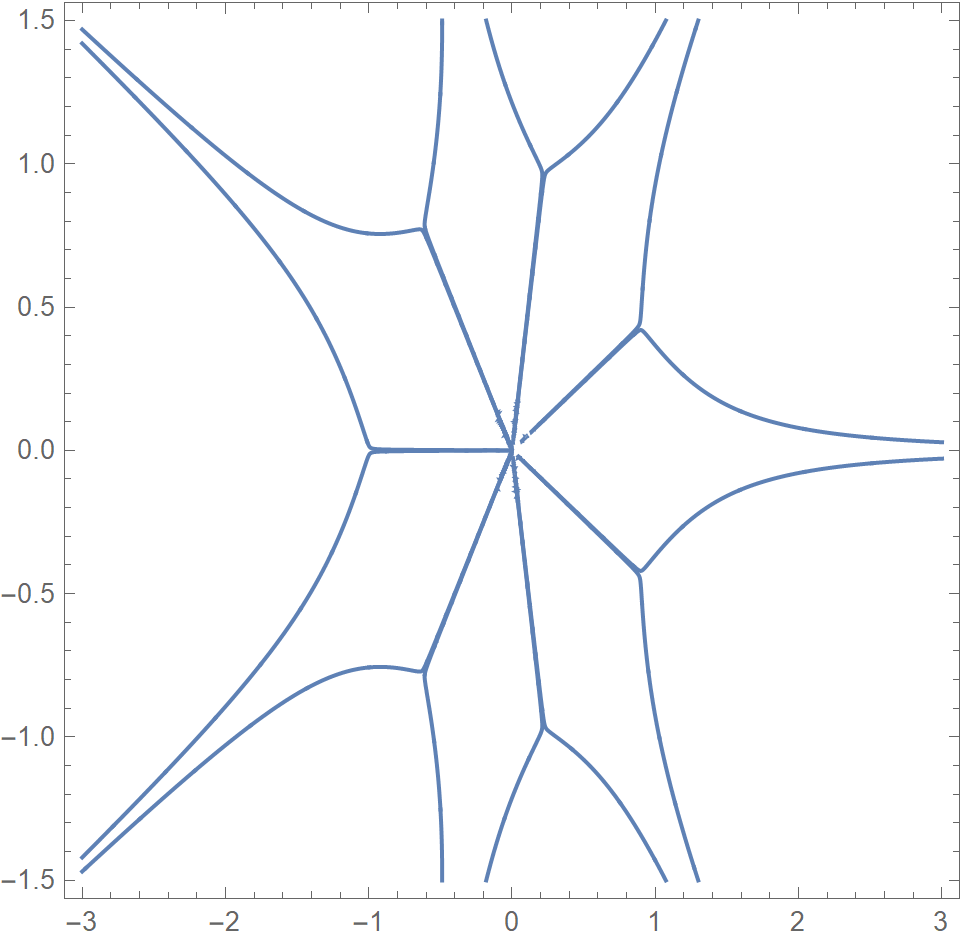
The more complicated function given in a comment below yields the following plot.

f7[z] := Sqrt[-1 - z^7] - ArcTan[Sqrt[-1 - z^7]]
ComplexContourPlot[Re[f7[z]] == -10^-2, {z, -3 - 3/2 I, 3 + 3/2 I}, 
    Exclusions -> None, PlotPoints -> 1000]

enter image description here

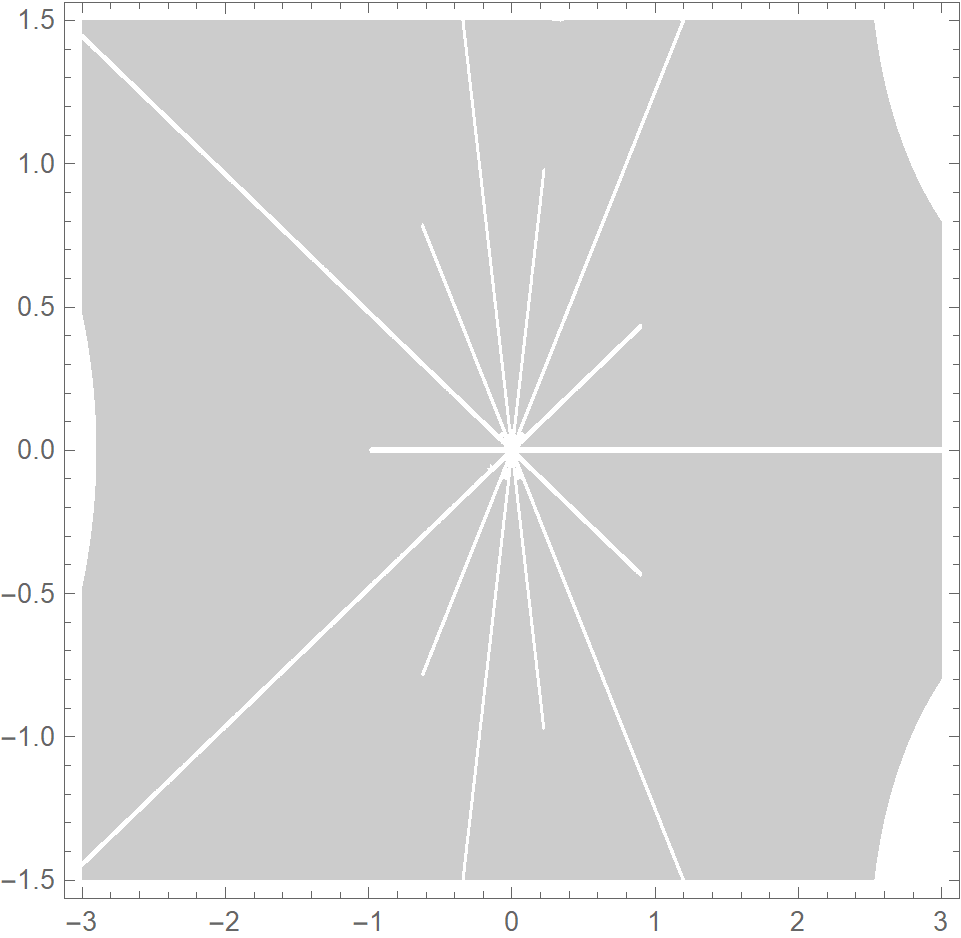
That some tuning of PlotPoints and of the right side of Re[f7[z]] == -10^-2 is necessary should not be surprising. ContourPlot apparently was not designed to display contours overlapping branch cuts, which ordinarily are excluded. Locations of the branch cuts can be displayed by

ComplexContourPlot[Re[f7[z]], {z, -3 - 3/2 I, 3 + 3/2 I}, 
    Contours -> 0, PlotPoints -> 100]

enter image description here

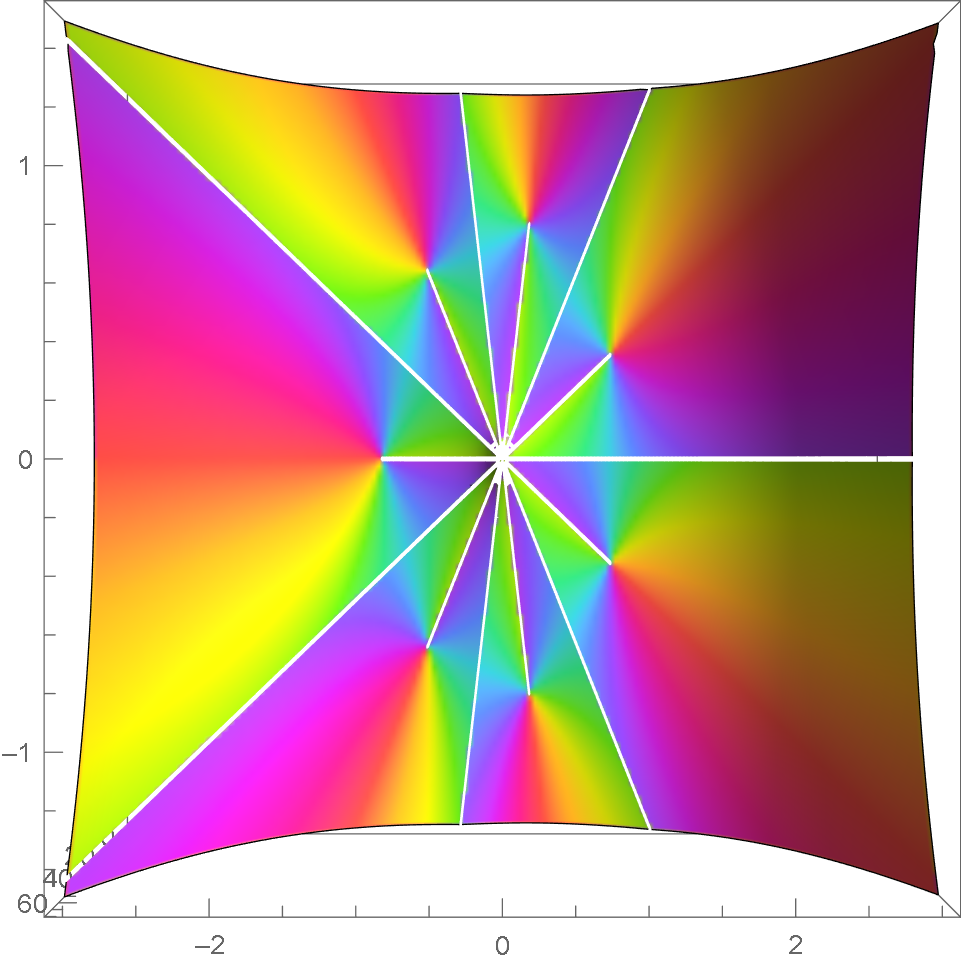
A more colorful version is provided by

ComplexPlot3D[f7[z], {z, -3 - 3/2 I, 3 + 3/2 I}, PlotPoints -> 100, 
    ViewPoint -> Above]

enter image description here

Viewing this 3D plot from different ViewPoints shows that Re[f7[z]] is zero on the seven short branch cuts, but not on the other seven.

$\endgroup$
2
  • 1
    $\begingroup$ Thanks for your reply. 1, please do not replace ${\rm Im}[g(z)]$ by ${\rm Re}[g(z)]$, it is not right; 2, to check if you method is universal, you could change the power in the square root, say f[z] := Sqrt[-1 - z^7] - ArcTan[Sqrt[-1 - z^7]], I do know the correct result, but you code does not show it. $\endgroup$
    – user142288
    Commented Oct 30, 2020 at 6:49
  • 2
    $\begingroup$ @user142288 I have plotted the more complex function, as requested. I do not understand your comment on g[z], which I have not used in my answer. $\endgroup$
    – bbgodfrey
    Commented Oct 30, 2020 at 13:24

Your Answer

By clicking “Post Your Answer”, you agree to our terms of service and acknowledge you have read our privacy policy.

Not the answer you're looking for? Browse other questions tagged or ask your own question.