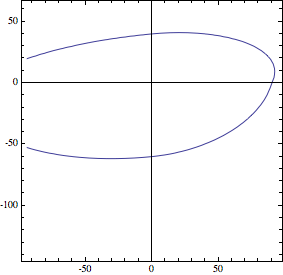
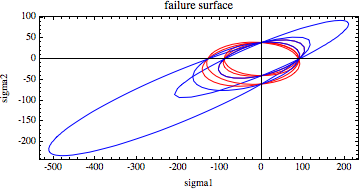
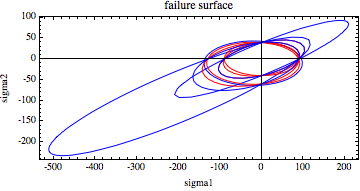
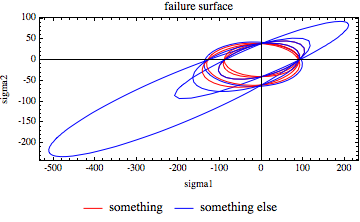
I have 2 problems with which I would need help: -first one is that I would like to plot a discontinuous function of 2 variables but can't succeed (see attachment) -then I also would like to display a legend with a contour plot on which there are several ellipses but can't figure out (also see attachment). I don't want the usual contourplot legend with color graduation but one like : blue->ellipse one red->ellipse two
    s1t = 90
    s2t = 40
    s1c = -130
    s2c = -60
    f[x_, y_] := (x/s1t)^2 + (y/s2t)^2 - x*y/(s1t)^2 /; x > 0 && y > 0
    f[x_, y_] := (x/s1t)^2 + (y/Abs[s2c])^2 - x*y/(Abs[s1c])^2 /;
x > 0 && y < 0
    f[x_, y_] := (x/Abs[s1c])^2 + (y/s2t)^2 - x*y/(s1t)^2 /;
x < 0 && y > 0
    f[x_, y_] := (x/Abs[s1c])^2 + (y/Abs[s2c])^2 - x*y/(Abs[s1c])^2 /;
x < 0 && y < 0
    ContourPlot[f == 1, {x, -30 Pi, 30 Pi}, {y, -45 Pi, 20 Pi},
Axes -> {True, True}]
    ContourPlot[{(x/s1t)^2 - x*y/(s1t*s2t) + (y/s2t)^2 ==
1, (x/s1t)^2 + (y/s2t)^2 + x*y*(1/(s1t^2) - 1/(s2t^2)) == 1,
x^2/(s1t^2) + y^2/(s2t^2) - x*y/(s1t^2) == 1,
x^2/(s1t*Abs[s1c]) +
y^2/(s2t*Abs[s2c]) + (1/s1t - 1/Abs[s1c])*
 x + (1/s2t - 1/Abs[s2c])*y +
2*x*y*1/(2*s45^2)*(1 - (1/s1t - 1/Abs[s1c] + 1/s2t - 1/Abs[s2c])*
    s45 - (1/(s1t*Abs[s1c]) + 1/(s2t*Abs[s2c]))*s45^2) == 1,
x^2/Abs[(s1t*s1c)] +  y^2/Abs[(s2t*s2c)] + (1/s1t - 1/Abs[s1c])*
 x + (1/s2t - 1/Abs[s2c])*y - 1/(2*Sqrt[s1t*s1c*s2t*s2c]) == 1,
x^2/Abs[(s1t*s1c)] +
y^2/Abs[(s2t*s2c)] + (1/s1t - 1/Abs[s1c])*
 x + (1/s2t - 1/Abs[s2c])*y + 1/Sqrt[s1t*s1c*s2t*s2c] -
1/(2*S^2) == 1, (x/s1t)^2 + (y/s2t)^2 ==
1, (x/s1t)^2 + (y/s2t)^2 - x*y/(s1t*s2t) ==
1, (x*y - x^2)/(s1t*s1c) - (y^2/(s2t*s2c)) +
x*(s1t + s1c)/(s1t*s1c) + y*(s2c + s2t)/(s2t*s2c) ==
1, (1.95*x*y - x^2)/(s1t*s1c) - (y^2/(s2t*s2c)) +
x*(s1c + s1t)/(s1t*s1c) + y*(s2c + s2t)/(s2t*s2c) ==
1}, {x, -165 Pi, 70 Pi}, {y, -75 Pi, 30 Pi}, Axes -> {True, True},
FrameLabel -> {sigma1, sigma2}, PlotLabel -> failure surface,
AspectRatio -> Automatic]


ContourPlot[f[x,y] == 1, {x, -30 Pi, 30 Pi}, {y, -45 Pi, 20 Pi}, Axes -> {True, True}]? $\endgroup$