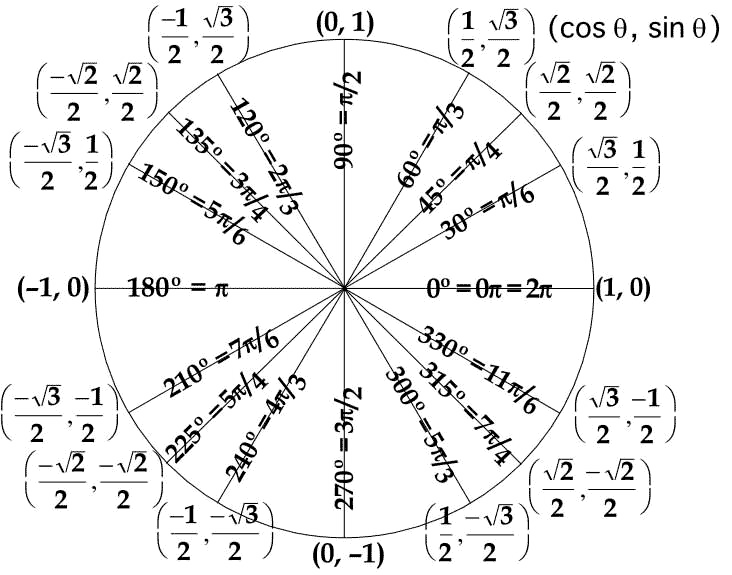
Struggling often with Trigonometry I would like to have some code to generate this Unit Circle Trigonometry. Would be of great help when I need to transform some data :

Struggling often with Trigonometry I would like to have some code to generate this Unit Circle Trigonometry. Would be of great help when I need to transform some data :

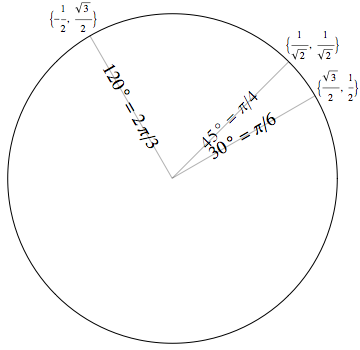
There are a couple tricky points here. Here's a start, which I imagine you can finish.
markings[t_] := Module[{o={0,0},p={Cos[t],Sin[t]},
  t2=Together[t],tFormat, rot},
  tFormat = If[Denominator[t2]=!=1,
    Row[{Numerator[t2],"/",Denominator[t2]}]];
  rot = If[TrueQ[Pi/2<Mod[t,2Pi]<3Pi/2],t+Pi,t];
    {{Opacity[0.3],Line[{o,p}]},
     Rotate[Inset[Style[
       Row[{t(180/Pi)Degree, " = ",tFormat}],
     FontSize->18], p/2],rot],
     Text[{Cos[t],Sin[t]},p,-1.3p]}
];
Graphics[{
  Circle[{0,0},1],
  Table[markings[t],{t,{Pi/6,Pi/4,2Pi/3}}]
}]

In addition to finishing it, logical enhancements would include: Making the Circle thicker, adjusting the size and/or format of the point labels, adding Points on the boundary, and/or making it dynamic.
Have fun!
tFormat need to include how the thing should look if the condition is False, i.e., unaltered t2? Or was that the thing for 500 to work out on his own?
$\endgroup$
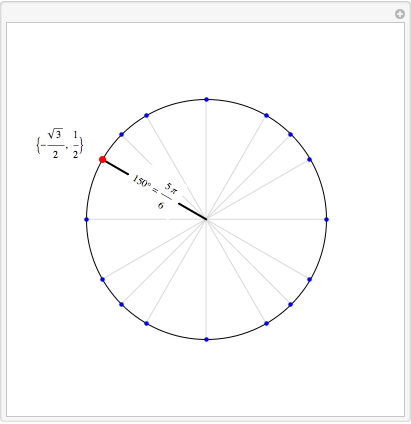
Here's a dynamic version (sorry, I couldn't resist).
Manipulate[
 DynamicModule[{alist, pt, pc},
  pt[a_] := {Cos[a], Sin[a]};
  alist =
   Union[Range[0, 2 Pi - Pi/6, Pi/6], Range[0, 2 Pi - Pi/4, Pi/4]];
  a = Nearest[alist, Mod[ArcTan @@ p, 2 Pi, 0]][[1]];
  pc = pt[a];

  Graphics[{
    Circle[],
    {LightGray, Line[{{0, 0}, pt[#]}] & /@ alist},
    {PointSize[Medium], Blue, Point[pt /@ alist]},
    {AbsoluteThickness[2], Line[{{0, 0}, pc}]},
    {PointSize[Large], Red, Point[pc]},
    Text[pc, pc, -2 pc],
    Text[Framed[Row[{a/Pi/2 360, "\[Degree] = ", a}],
      Background -> White, FrameStyle -> None], pc/2, {0, 0},
     pt[Mod[a, Pi, -Pi/2]]]},
   PlotRange -> {{-1.5, 1.5}, {-1.5, 1.5}}]],
 {{p, {1, 0}}, Locator, Appearance -> None},
 {{a, 0}, None}]

Clear["Global`*"]

cpts[r_Real, a_List] := {r Cos[#], r Sin[#]} & /@ a

rmain = 1;
anglesRadians = # + {0, π/6, π/4, π/3} & /@
    Range[0, 3 π/2, π/2] // Flatten;
(*anglesRadians=Range[0,2π,π/12];*)
anglesDegrees = anglesRadians (180/π);
coords = (StringForm["(``,``)", Cos[#], Sin[#]] & /@ anglesRadians);
tancoords = (StringForm["``", Tan[#]] & /@ anglesRadians) /.
   ComplexInfinity -> ∞;
labels = Rotate[#,
       If[π/2 < Last@# < 3 π/2, Last@# + π, Last@#]] & /@
     TraditionalForm[#] & /@ (StringForm["``° = `` rad",
       First@#, Last@#] & /@
     Transpose[{anglesDegrees, anglesRadians}] );

ListPlot[Evaluate@MapThread[Callout[#1, Style[#2, 12]
     (*,CalloutMarker\[Rule]"CirclePoint"*)
     (*,CalloutStyle\[Rule]Blue*)
     , LeaderSize -> {12, ArcTan @@ #1, 4}] &
   , {cpts[1.0 rmain, anglesRadians], coords}
   ]
 , PlotStyle -> {AbsolutePointSize[6], Red}
 , PlotRange -> {{ -rmain, rmain}, {- rmain, rmain}}
 (* PlotRange for the tangent ring *)
 (*{{ -1.4rmain,1.4rmain},{ -1.4rmain,1.4rmain}}*)
 , AspectRatio -> Automatic
 , Axes -> False
 , ImageSize -> 600
 , PlotRangePadding -> {Scaled[0.12], Scaled[0.12]}
 , Epilog -> {
   {Thin, Dashed, Line[{{0, 0}, #}] & /@
     cpts[0.4 rmain, anglesRadians]}
   , {Thin, Dashed, MapThread[Line[{#1, #2}] &
     , {cpts[0.8 rmain, anglesRadians]
      , cpts[1.0 rmain, anglesRadians]}
     ]}
   , {MapThread[Text[Style[#1, 12, Blue], #2] &
     , {labels, cpts[0.6 rmain, anglesRadians]}] }

   (*--------------------------------*)
   (* enable only if an annulus with Tan() values  is required
   , expect to do some tinkering to fonts/plotrange *)

   (*,{FaceForm[{Opacity[0.2,Nest[Lighter,Brown,1]]}]
   ,EdgeForm[{Dashed,Black}]
   ,Annulus[{0,0},{1.5rmain,1.75rmain}]}
   ,{ MapThread[Text[Style[#1,11,Black],#2]&
   ,{tancoords,cpts[1.62 rmain,anglesRadians]}]}*)

   (*--------------------------------*)
   }
 , Prolog -> {
   {FaceForm[Nest[Lighter, Cyan, 3]], EdgeForm[{Dashed, Black}],
    Disk[{0, 0}, rmain]}
   }
 ]
Usage notes
rmain is the radius of the main circle. If the user chooses a value other than 1, it would still work, but then the user must keep the Axes and Frame turned off or else the labels would not make much sense.
The function cpts generates points around the main circle for the list of angles. This is used many times while plotting various primitives.
I wanted to use Callout, so resorted to ListPlot.
An Annulus that displays Tan[θ] values can be enabled by un-commenting the indicated code lines.
PadRight :-) )
$\endgroup$