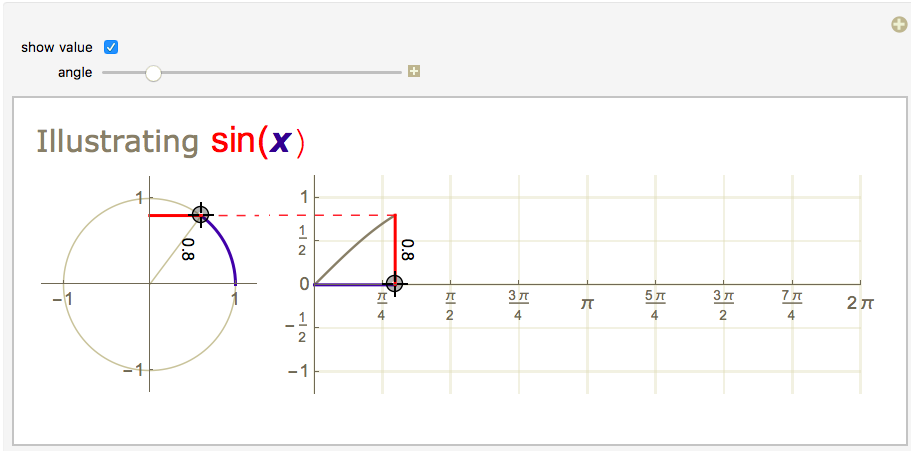
The interactive works by moving the dial on the unit circle which will change the angle and thus will trace the graph. However, I am wanting this interactive to span angles from -2pi to 4pi and I want the value for the angle to be shown on the unit circle when you change the dial.
The current code is shown bellow
Manipulate[
Module[{anglegraph, maingraph},
anglegraph[th_, showtext_] := Show[
Graphics[{
  {Lighter[Gray, 0.5], Circle[{0, 0}, 1]},
  {Darker[Blue, 0.2], Thick, Circle[{0, 0}, 1, {0, th}]},
  {Lighter[Gray, 0.5], Line[{{0, 0}, {Cos[th], Sin[th]}}]},
  {Red, Thick, Line[{{0, Sin[th]}, {Cos[th], Sin[th]}}]},
  If[showtext,
   Rotate[Text[
     Style[N[Sin[th]], 11], {Cos[th] - 0.15, Sin[th]/2}],
    3 Pi/2, {Cos[th] - 0.15, Sin[th]/2}], {}],
  {Lighter[Red, 0.3], Dashing[Medium],
   Line[{{Cos[th], Sin[th]}, {2, Sin[th]}}]}
  }],
PlotRange -> 1, ImageSize -> 145, BaseStyle -> {12}, Axes -> True,
 Ticks -> {{-1, 1}, {-1, 1}}, PlotRange -> {{-1, 1}, {-1, 1}},
PlotRangePadding -> 0.25];

maingraph[th_, showtext_] := Module[{},
Show[Plot[{Sin[x]}, {x, 0.0001, th},
  PlotRange -> {{0, 2 Pi}, {-1, 1}},
  PlotRangePadding -> {0, 0.25},
  ImagePadding -> {{30, 12}, {0, 0}}, PlotRangeClipping -> False,
  PlotStyle -> Gray,
  Ticks -> {Table[{n Pi/4, n Pi/4}, {n, 0, 8}],
    Table[n, {n, -1, 1, 1/2}]},
  GridLines -> {Table[{n Pi/4, Lighter[Gray, 0.7]}, {n, -2, 8}],
    Table[{n, Lighter[Gray, 0.7]}, {n, -1, 1, 1/2}]},
  ImageSize -> {Automatic, 145}],
 Graphics[{If[showtext,
    Rotate[Text[Style[N[Sin[th]], 11], {th + 0.15, Sin[th]/2}],
     3 Pi/2, {th + 0.15, Sin[th]/2}], {}],
   {Lighter[Red, 0.3], Dashing[Medium],
    Line[{{th, Sin[th]}, {-2, Sin[th]}}]},
   {Darker[Blue, 0.2], Thick, Line[{{0, 0}, {th, 0}}]},
   {Red, Thick, Line[{{th, 0}, {th, Sin[th]}}]}
   }], AspectRatio -> Automatic, BaseStyle -> {12}]];

 DynamicModule[{pt = {Cos[ptctrl], Sin[ptctrl]}, pt2 = {ptctrl, 0}},
   Labeled[Grid[{
  {LocatorPane[Dynamic[pt,
     {(pt = {Cos[pt2[[1]]], Sin[pt2[[1]]]}) &,
      (pt = Normalize[#];
        pt2 = {If[pt2 == {2 Pi, 0}, 2 Pi,
           Mod[ArcTan[#[[1]], #[[2]]], 2 Pi]], 0}) &,
      (pt = Normalize[#]; ptctrl = pt2[[1]]) &}],
    Dynamic[
     anglegraph[
      If[pt2 == {2 Pi, 0}, 2 Pi,
       Mod[ArcTan[pt[[1]], pt[[2]]], 2 Pi]], showvalue]]],
   LocatorPane[Dynamic[pt2,
     {(pt2 = {If[pt2 == {2 Pi, 0}, 2 Pi,
           Mod[ArcTan[pt[[1]], pt[[2]]], 2 Pi]], 0}) &,
      (pt2 = {#[[1]], 0}; pt = {Cos[#[[1]]], Sin[#[[1]]]}) &,
      (pt2 = {#[[1]], 0}; ptctrl = #[[1]]) &}],
    Dynamic[
     maingraph[
      If[pt2 == {2 Pi, 0}, 2 Pi,
       Mod[ArcTan[pt[[1]], pt[[2]]], 2 Pi]], showvalue]]]}},
 Spacings ->
  0], {Row[{Style["Illustrating ", "Label", 20, Gray],
   Text@Style["sin(", Red, 24],
   Text@Style["x", Italic, Bold, Darker[Blue, 0.3], 24],
   Style[")", Red, 24]}],
 Style["", 10, Lighter[Gray, 0.7], "Label"]}, {{Top,
  Left}, {Bottom, Right}}]]
],
 {{showvalue, False, "show value"}, {False, True}},
 {{ptctrl, Pi/6, "angle"}, 0, 2 Pi},
TrackedSymbols :> {showvalue, ptctrl}]
An image is shown bellow:


