There is an absolutely wonderful answer by Heike at Generate a Unit Circle Trigonometry. It is an answer that will lead me to a lot of learning.
Here is my playing with her code:
Graphics[{
  Circle[],
  {LightGray, Line[{{0, 0}, pt[#]}] & /@ alist},
  PointSize[Medium], Blue, Point[pt /@ alist],
  Text[pt[5 Pi/6], pt[5 Pi/6], -2 pt[5 Pi/6], Background -> Yellow],
  Text[pt[Pi/6], pt[Pi/6], -2 pt[Pi/6], Background -> Yellow],
  Red, PointSize[Large],
  Point[-2 pt[Pi/6]],
  Point[-2 pt[5 Pi/6]],
  }]
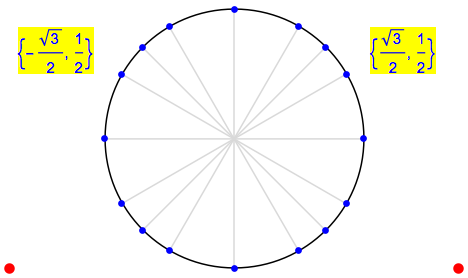
Which gives this image:
Now I worked through the examples in the documentation for the Text command and found that:
Graphics[{
  Text[Framed["ABCDEF"], {0, 0}, {-1, -1}],
  Circle[]
  }, Axes -> True, Ticks -> None]
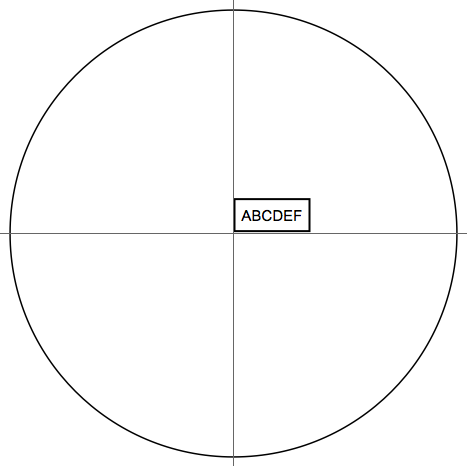
Puts the lower left corner of the textbook at the origin:
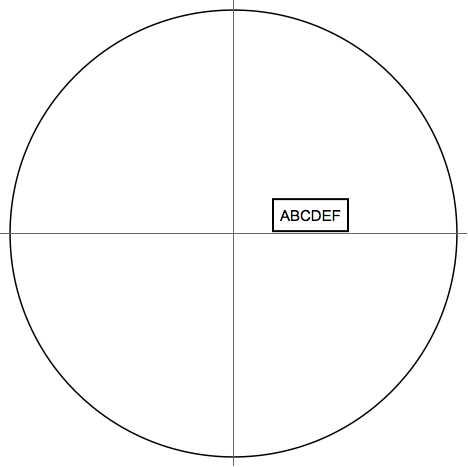
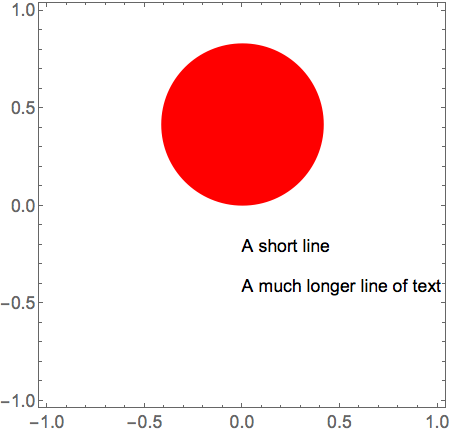
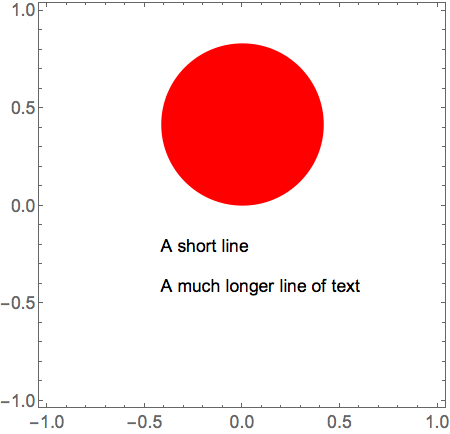
But then I am not sure why this moves the textbook as it does.
Graphics[{
  Text[Framed["ABCDEF"], {0, 0}, {-2, -1}],
  Circle[]
  }, Axes -> True, Ticks -> None]
Then, of course, I'd like to get back to the brilliant code by Heike, and understand how his labels work so wonderfully in my first block of code above.
I'd like to be able to understand this so well that I can explain it to my students and to faculty in one of my Mathematica sessions.

Texthas just been a proxy forInsetso if you want to really understand it look at that documentation instead. $\endgroup$