10
$\begingroup$

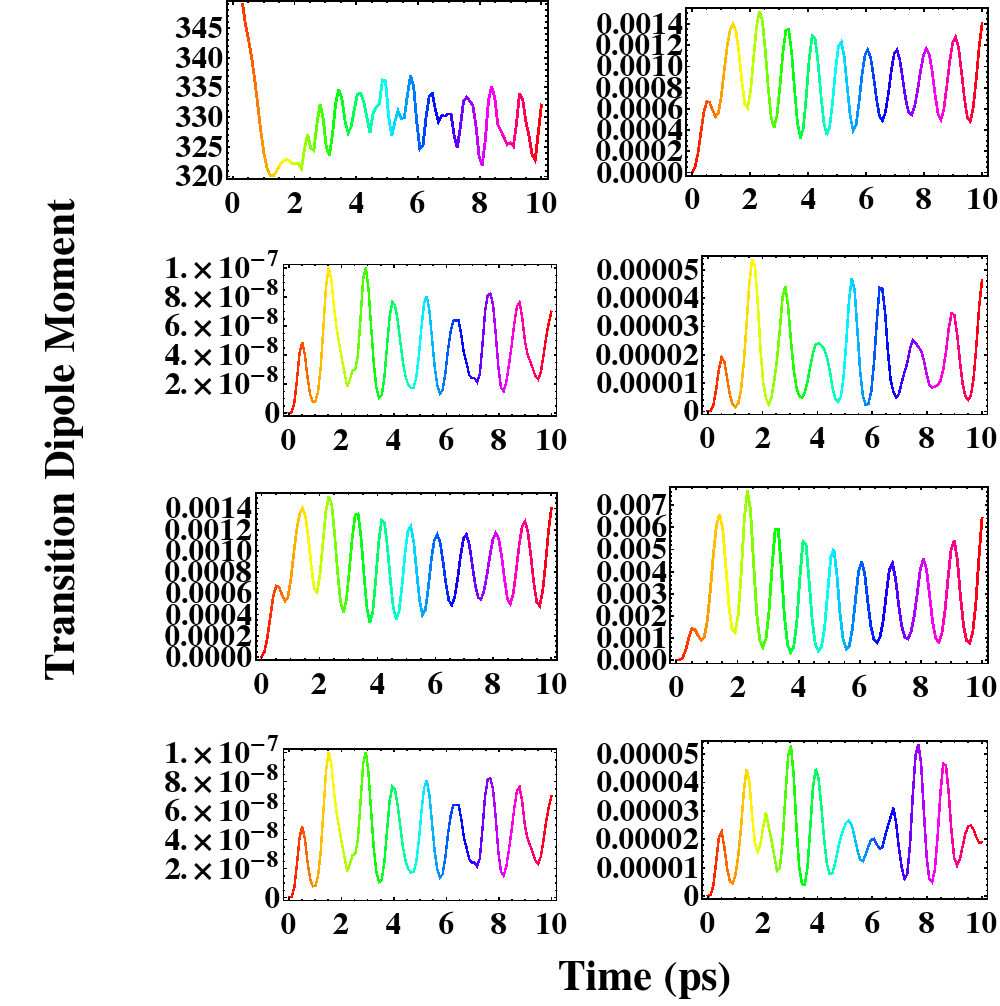
The figure below is made by MATLAB. However, the scientific form of numbers in FrameTicks that how MATLAB deals with is quite different from that of Mathematica.
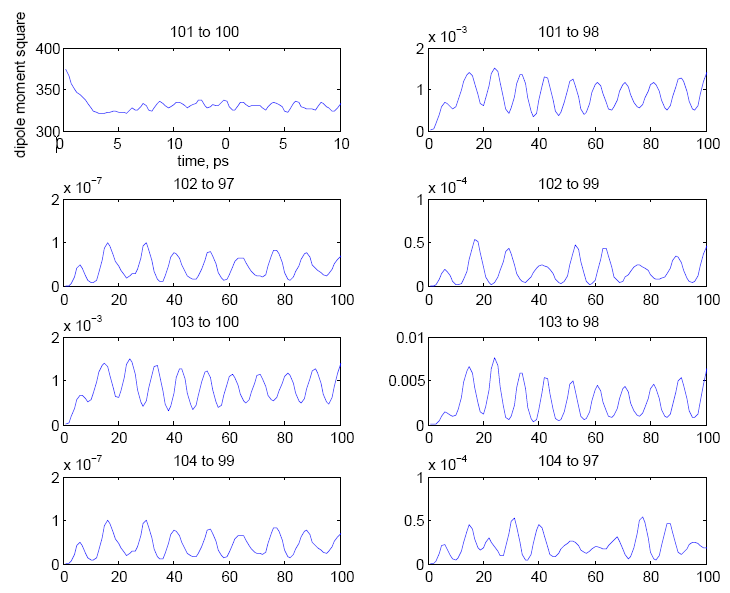
MATLAB plots with nice ticks

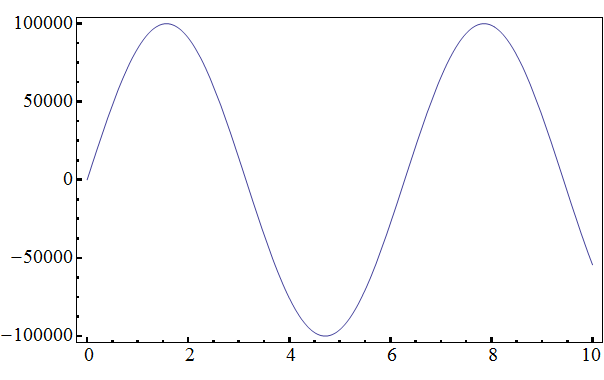
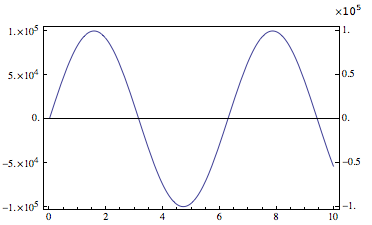
By default, I plot the second figure based on the same data in a Mathematica way. Mathematica plots However, what is messy in the second figure is the overused ZERO in the vertical axis. So my first question is how to transform the number on the FrameTicks into some suitable scientific form. Well, after we transform them into scientific form, my second question arises: how to make the plot in the MATLAB way? For example, if one of the frame ticks is 2*10^-4, I hope to put only 2 on the vertical axis and 10^-4 on the left top of the figure (Like the first one in the second column in the first figure). I think we can test the idea based on
Plot[10^5 * Sin[x], {x, 0, 10}, Frame -> True]

I think I can solve this problem in a stupid way: multiply/divide every number on the frame ticks by some number x, then place a graphics object of text which writes x to the left top side of the figure. But really what I need is a general way to do that. Any help will be appreciated.

$\endgroup$
3
  • 1
    $\begingroup$ There are many related questions around, search for ticks + number. You should also provide your Mathematica code used to generate your graphics - seems like some scaling issue is involved. $\endgroup$
    – Yves Klett
    Commented Apr 22, 2013 at 9:21
  • $\begingroup$ Thanks. However, I have tried searching for solution, still no better way to be implememt. Well, I should paste my code. But how about testing our ideas on the simple example I mentioned before the last paragraph. Thanks friend. $\endgroup$ Commented Apr 22, 2013 at 10:09
  • $\begingroup$ Please do post your code (as minimal working example), because things like Grid etc. may be playing a part as well. $\endgroup$
    – Yves Klett
    Commented Apr 22, 2013 at 11:31

3 Answers 3

9
$\begingroup$

You can probably get close to what you want with some fiddling. Make the ticks to your satisfaction:

leftticks = Table[{k,NumberForm[k,ExponentFunction->(If[-2<#<2,Null,#]&)]},
   {k, -10^5, 10^5,50000.}]
rightticks = Table[{k,k/10^5},{k, -10^5, 10^5, 10.0^5/2}]

Then put them into the Plot function.

Labeled[
   Plot[10^5 Sin[x],{x,0,10},
     Frame -> True,
     FrameTicks->{{leftticks, rightticks}, {Automatic,None}}],
  {"*10^5", "1.2"}, {{Top,Right}}]

image

Perhaps the flexibility compensates for the fiddliness...

$\endgroup$
7
$\begingroup$

You should post your source code for doing the fancy plots.. Yet, working from your suggested example, TickLabelFunction is an option from the LevelScheme package that does the trick. Get the package here.

Run it:

<< LevelScheme`

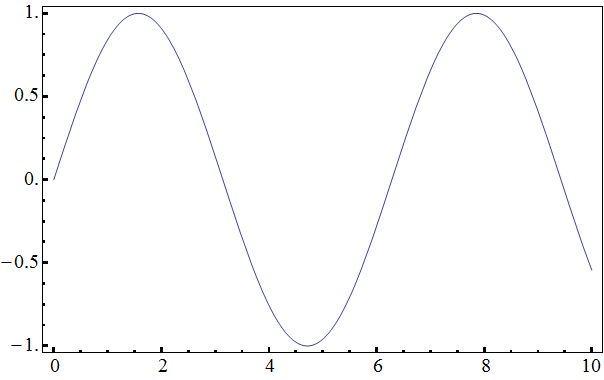
And then use the TickLabelFunction to label your plot. Notice how you are not labeling the axes, but the frame. You go from this:

Plot[10^5*Sin[x], {x, 0, 10}, Frame -> True, 
 FrameTicks -> {{LinTicks[-1*^5, 1*^5, 5*^4, 4, 
     MajorTickStyle -> Thickness[0.005], 
     MinorTickStyle -> Thickness[0.005]], 
    None}, {LinTicks[0, 10, 2, 4, MajorTickStyle -> Thickness[0.005], 
     MinorTickStyle -> Thickness[0.005]], None}}]

enter image description here

To this

Plot[10^5*Sin[x], {x, 0, 10}, Frame -> True, 
 FrameTicks -> {{LinTicks[-1*^5, 1*^5, 5*^4, 4, 
     MajorTickStyle -> Thickness[0.005], 
     MinorTickStyle -> Thickness[0.005], 
     TickLabelFunction -> Function[x, N[x 1*^-5]]], 
    None}, {LinTicks[0, 10, 2, 4, MajorTickStyle -> Thickness[0.005], 
     MinorTickStyle -> Thickness[0.005]], None}}]

enter image description here

$\endgroup$
0
1
$\begingroup$

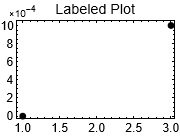
If you have a title, the accepted answer won't work very well. In this case, I think that the Epilog, PlotRangeClipping->False, ImagePadding->40 might be the lowest effort solution, as seen here: Epilog with text not shown.

Caveat: Won't work well if you have data that is outside of the range of your plot.

ListPlot[{{1, 0}, {3, 10}}
 , Epilog -> {Text["x10^-4", {1.0, 11.5}]}
 , PlotRangeClipping -> False
 , PlotLabel -> "Labeled Plot"]

enter image description here

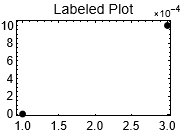
It gets a bit more finnicky if you want to put the label on the upper right corner:

ListPlot[{{1, 0}, {3, 10}}
 , Epilog -> {Text["x10^-4", {3.0, 11.5}]}
 , PlotRangeClipping -> False
 , ImagePadding -> {{Automatic, 10}, {Automatic, Automatic}}
 , PlotLabel -> "Labeled Plot"]

enter image description here

$\endgroup$

Your Answer

By clicking “Post Your Answer”, you agree to our terms of service and acknowledge you have read our privacy policy.

Not the answer you're looking for? Browse other questions tagged or ask your own question.