2
$\begingroup$

Here is a plot with the default frame ticks

S1 = Plot[Sin[x], {x, -7, 7}, Frame -> True, Axes -> False]
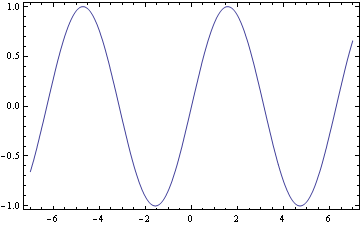
enter image description here

Now, if I define myself the range as well as the step separation of the left frame ticks by

S2 = Plot[Sin[x], {x, -7, 7}, 
  Frame -> True, 
  FrameTicks -> {{Range[-1, 1, 0.2], Automatic}, {Automatic, Automatic}}, 
  Axes -> False]

I get the following output
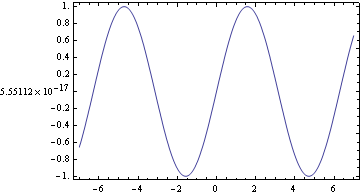
enter image description here

Well, there are two obvious issues. First of all, 0 should be not be shown in CPU accuracy. Moreover, all ticks should have the same number of decimal digits so, -1. should be -1.0, 1. should be 1.0 and 0 should be 0.0.

How can I get this?

$\endgroup$
4
  • $\begingroup$ Try this first and then redo the plot. SetOptions[$FrontEndSession, PrintPrecision -> 6] screen shot !Mathematica graphics $\endgroup$
    – Nasser
    Commented Feb 16, 2014 at 10:31
  • $\begingroup$ @Nasser I used this option but it had no effect. $\endgroup$
    – Vaggelis_Z
    Commented Feb 16, 2014 at 10:38
  • $\begingroup$ No problem with '0' for me. You can try to use ClearAll["Global*"]` to remove the definition of S1, S2 before plotting and try to add WorkingPrecision -> MachinePrecision in the Plot command. $\endgroup$
    – Nam Nguyen
    Commented Feb 16, 2014 at 11:03
  • 1
    $\begingroup$ No problem with 0 for me either... in any case, you can just Chop the ticks. $\endgroup$
    – rm -rf
    Commented Feb 16, 2014 at 14:23

1 Answer 1

3
$\begingroup$
Plot[Sin[x], {x, -7, 7}, Frame -> True, 
  FrameTicks -> {{{#, NumberForm[N@#, {2, 1}]} & /@ Range[-1, 1, 0.2], Automatic},
 {Automatic, Automatic}}, Axes -> False]
$\endgroup$

Your Answer

By clicking “Post Your Answer”, you agree to our terms of service and acknowledge you have read our privacy policy.

Not the answer you're looking for? Browse other questions tagged or ask your own question.