added 4 characters in body
Source Link
m_goldberg
  • 108.2k
  • 16
  • 104
  • 259

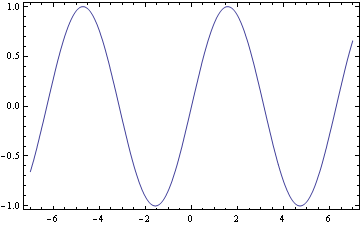
Here is a plot with the default frame ticks

S1 = Plot[Sin[x], {x, -7, 7}, Frame -> True, Axes -> False]
enter image description here

Now, if I define myself the range as well as the step separation of the left frame ticks by

S2 = Plot[Sin[x], {x, -7, 7}, 
  Frame -> True, 
  FrameTicks -> {{Range[-1, 1, 0.2], Automatic}, {Automatic, Automatic}}, 
  Axes -> False]

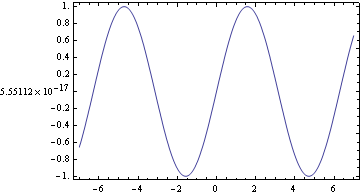
Plot[Sin[x], {x, -7, 7}, Frame -> True, FrameTicks -> {{Range[-1, 1, 0.2], Automatic}, {Automatic, Automatic}}, Axes -> False]

I get the following output
enter image description here

Well, there are two obvious issues. First of all, 0 should be not be shown in CPU accuracy. Moreover, all ticks should have the same number of decimal digits so, -1. should be -1.0, 1. should be 1.0 and 0 should be 0.0.

How can I get this?

Here is a plot with the default frame ticks

S1 = Plot[Sin[x], {x, -7, 7}, Frame -> True, Axes -> False]

enter image description here

Now, if I define myself the range as well as the step separation of the left frame ticks by

S2 = 

Plot[Sin[x], {x, -7, 7}, Frame -> True, FrameTicks -> {{Range[-1, 1, 0.2], Automatic}, {Automatic, Automatic}}, Axes -> False]

I get the following output

enter image description here

Well, there are two obvious issues. First of all, 0 should be not be shown in CPU accuracy. Moreover, all ticks should have the same number of decimal digits so, -1. should be -1.0, 1. should be 1.0 and 0 should be 0.0.

How can I get this?

Here is a plot with the default frame ticks

S1 = Plot[Sin[x], {x, -7, 7}, Frame -> True, Axes -> False]

enter image description here

Now, if I define myself the range as well as the step separation of the left frame ticks by

S2 = Plot[Sin[x], {x, -7, 7}, 
  Frame -> True, 
  FrameTicks -> {{Range[-1, 1, 0.2], Automatic}, {Automatic, Automatic}}, 
  Axes -> False]

I get the following output

enter image description here

Well, there are two obvious issues. First of all, 0 should be not be shown in CPU accuracy. Moreover, all ticks should have the same number of decimal digits so, -1. should be -1.0, 1. should be 1.0 and 0 should be 0.0.

How can I get this?

added 4 characters in body
Source Link
m_goldberg
  • 108.2k
  • 16
  • 104
  • 259

Here is a plot with the default frame ticks

S1 = Plot[Sin[x], {x, -7, 7}, Frame -> True, Axes -> False]

enter image description here

Now, if I define myself the range as well as the step separation of the left frame ticks by

S2 = 

Plot[Sin[x], {x, -7, 7}, Frame -> True, FrameTicks -> {{Range[-1, 1, 0.2], Automatic}, {Automatic, Automatic}}, Axes -> False]

I get the following output

enter image description here

Well, there are two obvious issues. First of all, 0 should be not be shown in CPU accuracy. Moreover, all ticks should have the same number of decimal digits so, -1. should be -1.0, 1. should be 1.0 and 0 should be 0.0.

How can I get this?

Here is a plot with the default frame ticks

S1 = Plot[Sin[x], {x, -7, 7}, Frame -> True, Axes -> False]

enter image description here

Now, if I define myself the range as well as the step separation of the left frame ticks by

S2 = 

Plot[Sin[x], {x, -7, 7}, Frame -> True, FrameTicks -> {{Range[-1, 1, 0.2], Automatic}, {Automatic, Automatic}}, Axes -> False]

I get the following output

enter image description here

Well, there are two obvious issues. First of all, 0 should be not be shown in CPU accuracy. Moreover, all ticks should have the same number of decimal digits so, -1. should be -1.0, 1. should be 1.0 and 0 should be 0.0.

How can I get this?

General cleanup
Source Link
m_goldberg
  • 108.2k
  • 16
  • 104
  • 259

OK, hereHere is a plot with the default frame ticks

S1 = Plot[Sin[x], {x, -7, 7}, Frame -> True, Axes -> False]

enter image description here

Now, if I define myself the range as well as the step separation of the left frame ticks by

S2 = Plot[Sin[x], {x, -7, 7}, Frame -> True, FrameTicks -> 
     {{Range[-1, 1, 0.2], Automatic}, {Automatic, Automatic}}, 
     Axes -> False]

Plot[Sin[x], {x, -7, 7}, Frame -> True, FrameTicks -> {{Range[-1, 1, 0.2], Automatic}, {Automatic, Automatic}}, Axes -> False]

I get the following output

enter image description here

Well, there are two obvious issues. First of all, it0 should be 0 not the equivalent of thebe shown in CPU accuracy. Moreover, all ticks should have the same number of decimal digits so, -1. should be -1.0, 1. should be 1.0 and even0 should be 0.0.

How can I get this done?

Many thanks in advance!

OK, here is a plot with the default frame ticks

S1 = Plot[Sin[x], {x, -7, 7}, Frame -> True, Axes -> False]

enter image description here

Now, if I define myself the range as well as the step separation of the left frame ticks by

S2 = Plot[Sin[x], {x, -7, 7}, Frame -> True, FrameTicks -> 
     {{Range[-1, 1, 0.2], Automatic}, {Automatic, Automatic}}, 
     Axes -> False]

I get the following output

enter image description here

Well, there are two obvious issues. First of all, it should be 0 not the equivalent of the CPU accuracy. Moreover, all ticks should have the same number of decimal digits so, -1. should be -1.0, 1. should be 1.0 and even 0.0.

How can I get this done?

Many thanks in advance!

Here is a plot with the default frame ticks

S1 = Plot[Sin[x], {x, -7, 7}, Frame -> True, Axes -> False]

enter image description here

Now, if I define myself the range as well as the step separation of the left frame ticks by

S2 = 

Plot[Sin[x], {x, -7, 7}, Frame -> True, FrameTicks -> {{Range[-1, 1, 0.2], Automatic}, {Automatic, Automatic}}, Axes -> False]

I get the following output

enter image description here

Well, there are two obvious issues. First of all, 0 should be not be shown in CPU accuracy. Moreover, all ticks should have the same number of decimal digits so, -1. should be -1.0, 1. should be 1.0 and 0 should be 0.0.

How can I get this?

Source Link
Vaggelis_Z
  • 8.8k
  • 6
  • 36
  • 81
Loading