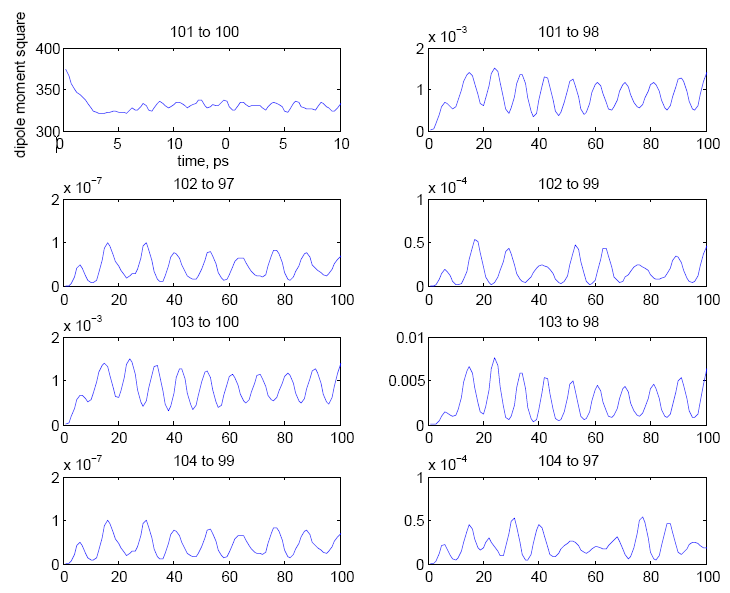
The figure below is made by matlabMATLAB. However, the scientific form of numbers in FrameTicksFrameTicks that how matlabMATLAB deals with is quite different from that of Mathematica.


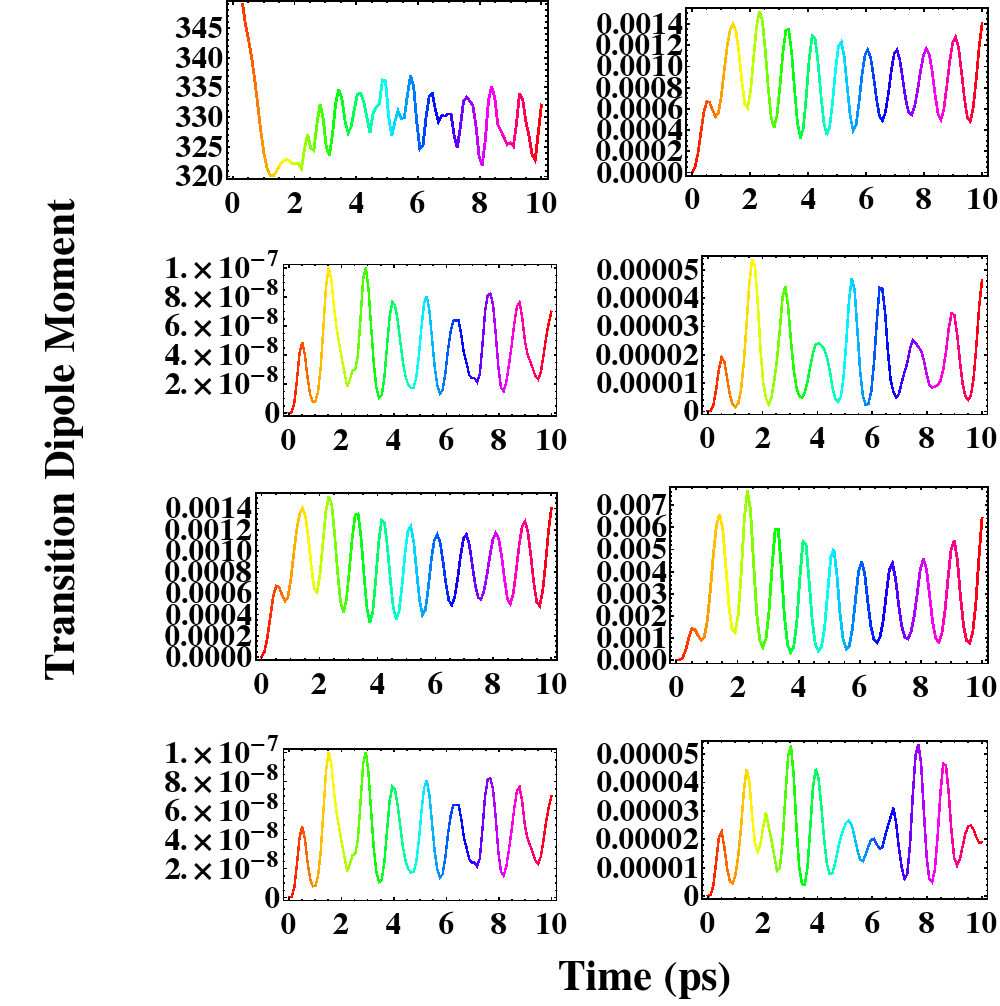
By default, I plot the second figure based on the same data in a Mathematica way.

 However, what is messmessy in the second figure is the overused ZERO in the vertical axis. So my first question is how to transform the number on the FrameTicks
FrameTicks into some suitable scientific form.
Well, after we transform them into scientific form, my second question arises: how to make the plot in the matlabMATLAB way? For example, if one of the frame ticks is 2*10^-4, I hope to put only 2 on the vertical axis and 10^-4 on the left top of the figure (Like the first one in the second column in the first figure).
I think we can test the idea based on
Plot[10^5*Sin[x]Plot[10^5 * Sin[x], {x, 0, 10}, Frame ->True]> True]
I think I can solve this problem in a stupid way: multiply/divide every number on the frame ticks by some number x, then place a graphics object of text which writes x to the left top side of the figure. But really what I need is a general way to do that. Any help will be appreciated.
