4
$\begingroup$

I have a bunch of 3D data (x, y coordinates and values) which is generated in Matlab and I need to render them in a 2D color map with certain axis ranges. Here are the Matlab code and the generated figure.

rho = linspace(0, 80, 100);
phi = linspace(0, 2*pi, 100);
[PHI,RHO] = meshgrid(phi, rho);
dat = rand(size(PHI)); % data was generated in cylindrical coordinate
[x, y] = pol2cart(PHI, RHO);
surf(x, y, data,'edgecolor','none'); shading interp;
view(0, 90);
axis equal; axis off;
xlim([-50, 50]); ylim([-50, 50])
save('data.mat', 'x', 'y', 'dat')
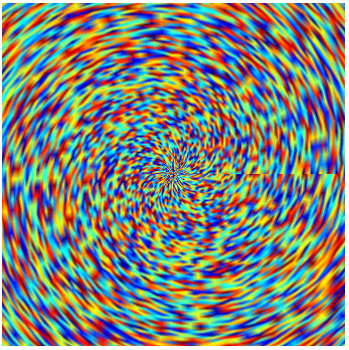
render 3d data into a 2d colormap

In Mathematica, I imported these data by evaluating

{x, y, dat} = Import["data.mat", "MAT"]

but I have no idea how to render them as shown above. I tried

ListPlot3D[{x, y, dat}]

It gave a 3D pattern but was extremely slow because I have a lot of data. Could anyone give me a hint to tackle this problem?

$\endgroup$
2
  • 1
    $\begingroup$ Could you please post the data for those of us who don't have matlab? $\endgroup$
    – s0rce
    Commented Mar 11, 2013 at 18:40
  • 1
    $\begingroup$ I guess the sample code could be: data = Flatten[ Table[{r Cos[i], r Sin[i], RandomReal[{0, Pi}]}, {i, 0, 2 Pi, 2 Pi/100.}, {r, 0, 80, 80/100.}], 1];ListDensityPlot[data, PlotRange -> {{-50, 50}, {-50, 50}}, ColorFunction -> Hue] $\endgroup$
    – halmir
    Commented Mar 11, 2013 at 18:52

1 Answer 1

6
$\begingroup$

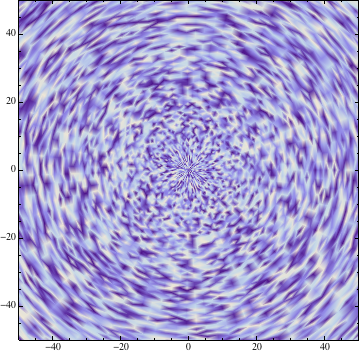
MATLAB's surf plots a parametric surface with the point $(x_i,y_j)$ colored according to the value in $\mathrm{dat}_{i,j}$. This is easily achieved with ListDensityPlot as follows:

ListDensityPlot[Thread[Flatten /@ {x, y, dat}], PlotRange -> {{-50, 50}, {-50, 50}}]

$\endgroup$
2
  • $\begingroup$ Thanks rm -rf, it works but take a lot of time if we upsample the data as commented by @halmir, say, from 100 to 500. Any idea to accelerate it? $\endgroup$
    – Tony Dong
    Commented Mar 11, 2013 at 19:15
  • $\begingroup$ It's probably because ListDensityPlot interpolates and tries to resample/refine it to a regular grid behind the scenes. I can't test this right now, but I'll take a look later in the day. $\endgroup$
    – rm -rf
    Commented Mar 11, 2013 at 20:16

Your Answer

By clicking “Post Your Answer”, you agree to our terms of service and acknowledge you have read our privacy policy.

Not the answer you're looking for? Browse other questions tagged or ask your own question.