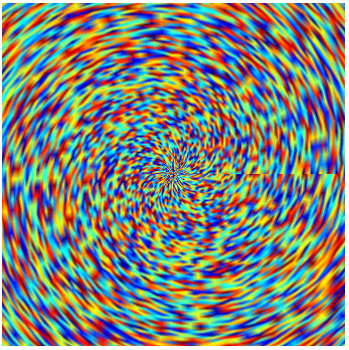
I have a bunch of 3D data (x, y coordinates and values) which is generated in Matlab and I need to render them in a 2D color map with certain axis ranges. Here are the Matlab code and the generated figure.
rho = linspace(0, 80, 100);
phi = linspace(0, 2*pi, 100);
[PHI,RHO] = meshgrid(phi, rho);
dat = rand(size(PHI)); % data was generated in cylindrical coordinate
[x, y] = pol2cart(PHI, RHO);
surf(x, y, data,'edgecolor','none'); shading interp;
view(0, 90);
axis equal; axis off;
xlim([-50, 50]); ylim([-50, 50])
save('data.mat', 'x', 'y', 'dat')

In Mathematica, I imported these data {x,y,dat}=Import["data.mat", "MAT"],by evaluating
{x, y, dat} = Import["data.mat", "MAT"]
but I have no idea how to render them as shown above. I tried ListPlot3D[{x,y,dat}].
ListPlot3D[{x, y, dat}]
It gave a 3D pattern andbut was extremely slow because I have a big numberlot of data (which is not 100x100 indeed). Matlab surf is very fast though. Could anyone give me a hint to tackle this problem?
