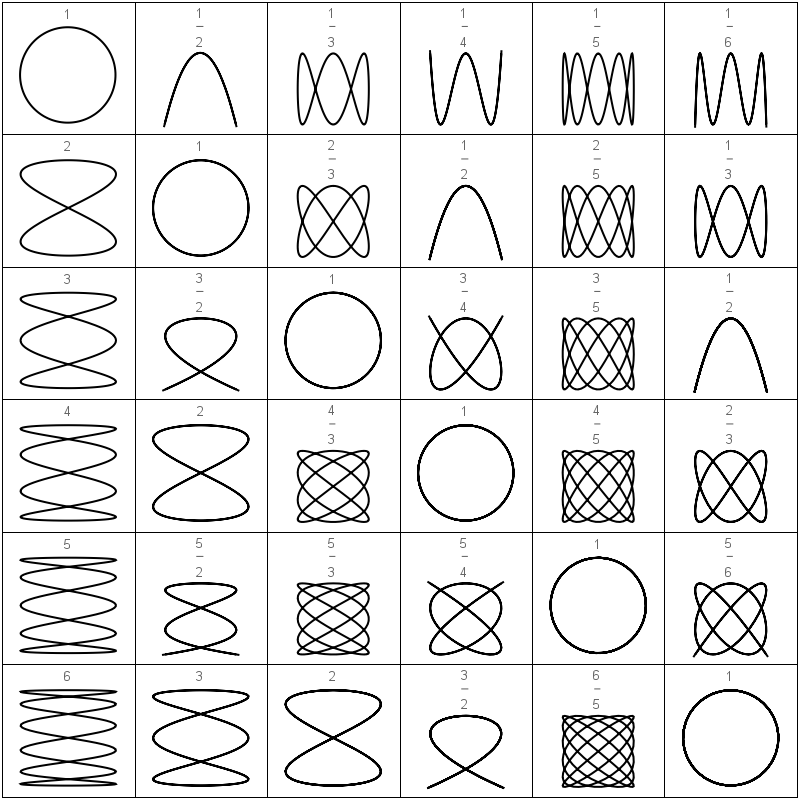
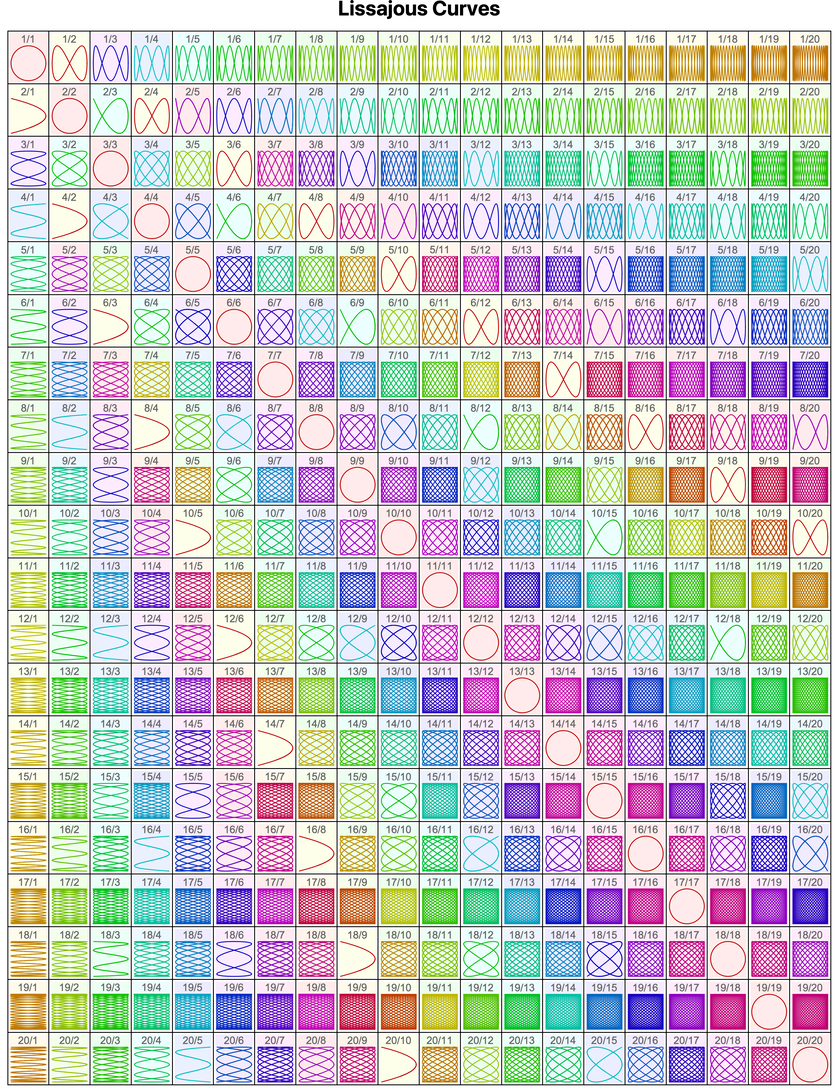
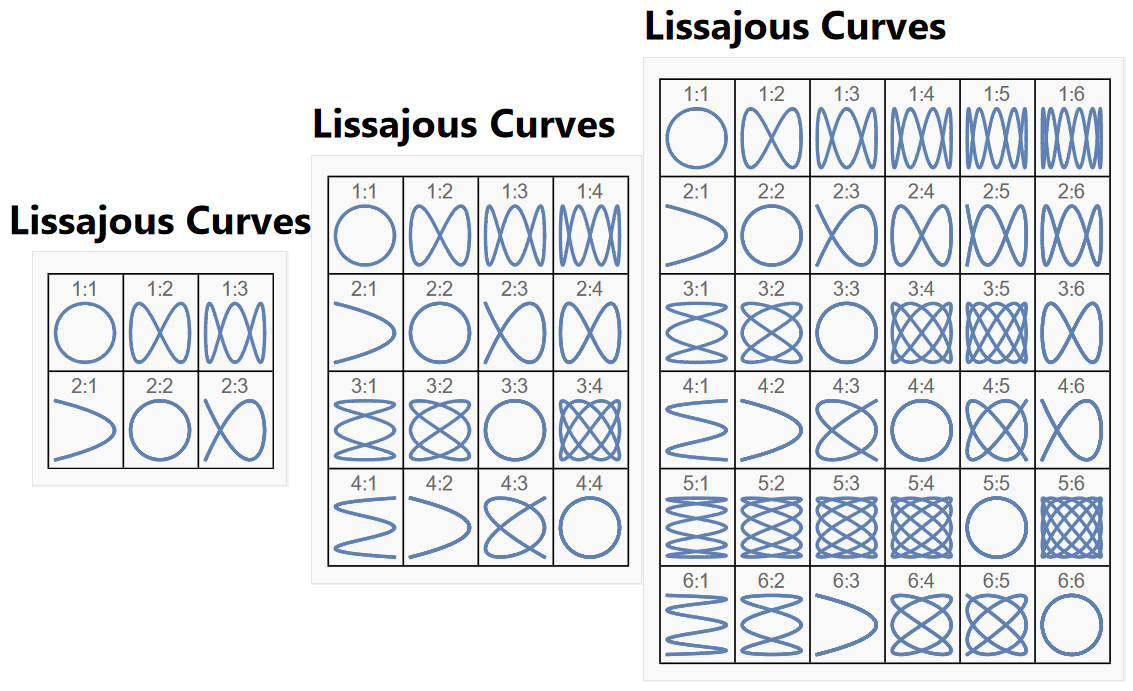
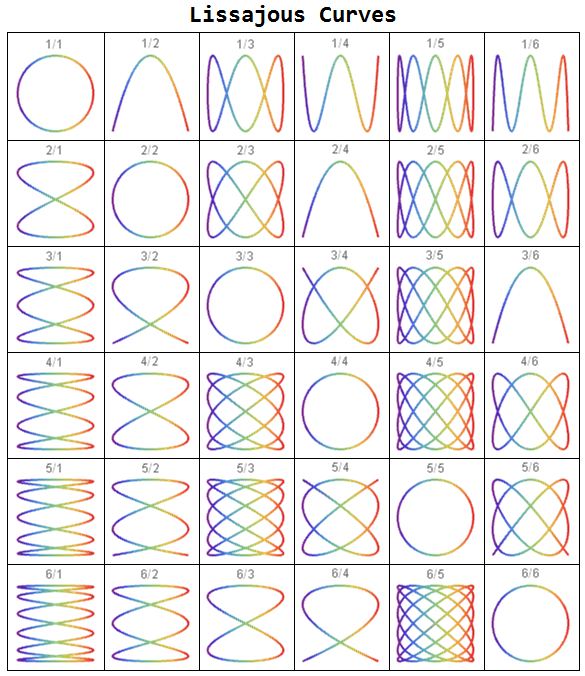
Overall, I'm quite happy with my Lissajous Curves poster maker; however, getting the final touches of the graphics just right has been a challenge. I've tried two different ways of constraining equally the proportions between curves: 1) Force the plot label ratio above to one line and; 2) Tried to force the proportions of the using PlotRange. I don't suppose there are any Mathematica experts out there who would care to share some ways of improving this graphical function? (I'm hoping to do some really big plots using my free Mathematica online cloud credits.)
makeLcurves[cols_,rows_] := Module[{graphics, radius = 0.45},
 (* Subroutines *)
 functionX[anglevar_, freq_] := radius * Sin[freq anglevar];
 functionY[anglevar_, freq_] := radius * Cos[freq anglevar];
 (* Draw Graphics*)
  graphics = Table[
  ParametricPlot[{functionX[t,x],functionY[t,y]},{t,0,2 Pi },
  Frame->False,
  Axes->False,
  PlotStyle->Directive[Thick,Black],
  PlotRange->{{-.5,.5},{-.5,.5}},
  Mesh->Automatic,
  PerformanceGoal->"Speed",
  PlotLabel->TraditionalForm[x/y ],
  AspectRatio->1],
  {x,rows},{y,cols}
 ];
GraphicsGrid[graphics,
 Frame->All,
 ImageSize->800]
]

makeLcurves[6,6] // Rasterize


Beveledas an option to aFractionBox. Or usePaneto enforce a height. $\endgroup$PlotLabel -> Row[{x, "/", y}]$\endgroup$