3
$\begingroup$

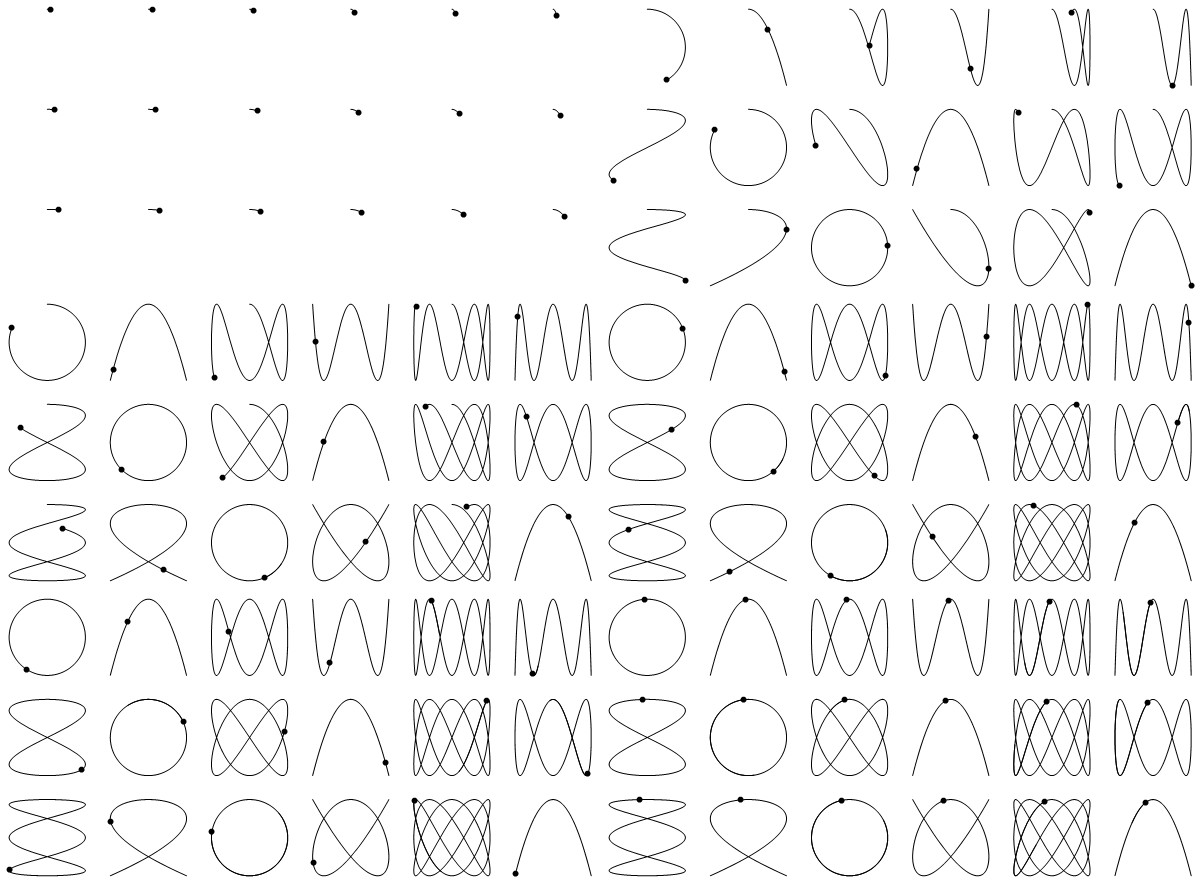
I love mathematical GIFs' power to illustrate and communicate math concepts widely. I haven't had much luck with the build-in ListAnimate on MMA Online but exporting GIFs to the cloud shows great promise. Building on an earlier question, I'm wondering if this GIF can't be improved as well? Performance is a bit of an issue as I'd like to scale it up a bit in the future, but also to my eye it's not drawing as smoothy as I'd like. The code is below; enjoy, and I'd appreciate any feedback.

functionX[anglevar_, freq_] := radius * Sin[freq anglevar]
functionY[anglevar_, freq_] := radius * Cos[freq anglevar]

animatecurves[cols_, rows_] := Module[{radius=0.45,steps=22},
Table[
 GraphicsGrid[
  Partition[
   Flatten[Table[ParametricPlot[{functionX[t,x],functionY[t,y]},{t,0,n},
    Axes->False,
    Frame->False,
    PlotRange->{{-.5,.5},{-.5,.5}},
    PlotPoints->10,
    PlotStyle->Directive[{AbsoluteThickness[.5],Black}],
    Epilog->{AbsolutePointSize[6],Point[{functionX[n,x],functionY[n,y]}]}],
    {x,rows},{y,cols}]],
   cols],
  ImageSize->600],
 {n,0.1,4 Pi, 4 Pi/steps}
 ]
]

  Export[CloudObject["AnimatedLissajousCurves1.gif"],graphicslist,"GIF",AnimationRepetitions->Infinity]

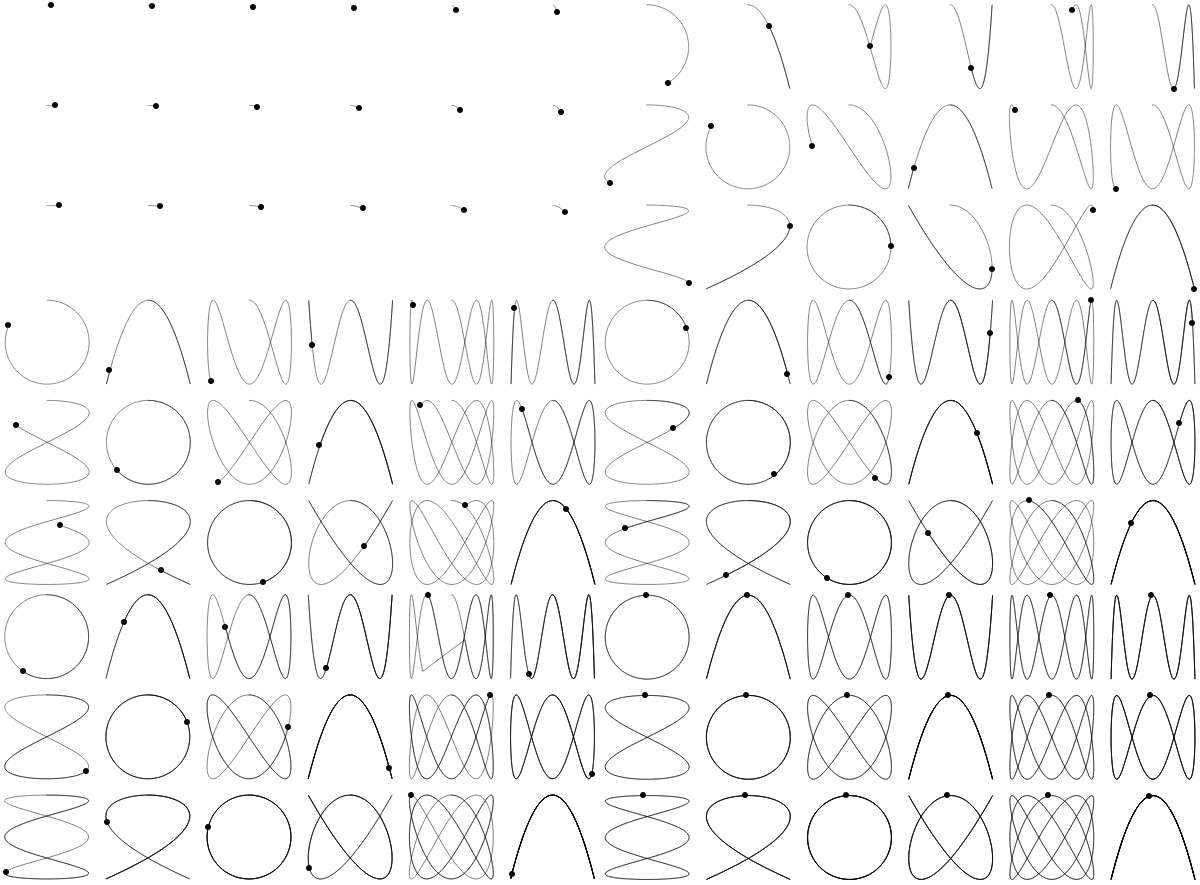
enter image description here

$\endgroup$
4
  • $\begingroup$ There doesn't seem to be any question in your post. $\endgroup$
    – m_goldberg
    Commented Jan 23, 2019 at 7:27
  • $\begingroup$ The gif is not as smooth (top right) as other animated plots on here and I'm wondering why because the code is nearly identical (ParametricPlot) in some cases. Just looking for some expertise in the nuances of Mathematica plotting. $\endgroup$
    – BBirdsell
    Commented Jan 23, 2019 at 7:44
  • $\begingroup$ an aside: you can remove Partition[Flaten[...],..]. $\endgroup$
    – kglr
    Commented Jan 23, 2019 at 7:48
  • 2
    $\begingroup$ Try to increase the PlotRange. The jiggling is maybe caused by a Point leaving the plot range. $\endgroup$ Commented Jan 23, 2019 at 8:54

2 Answers 2

4
$\begingroup$

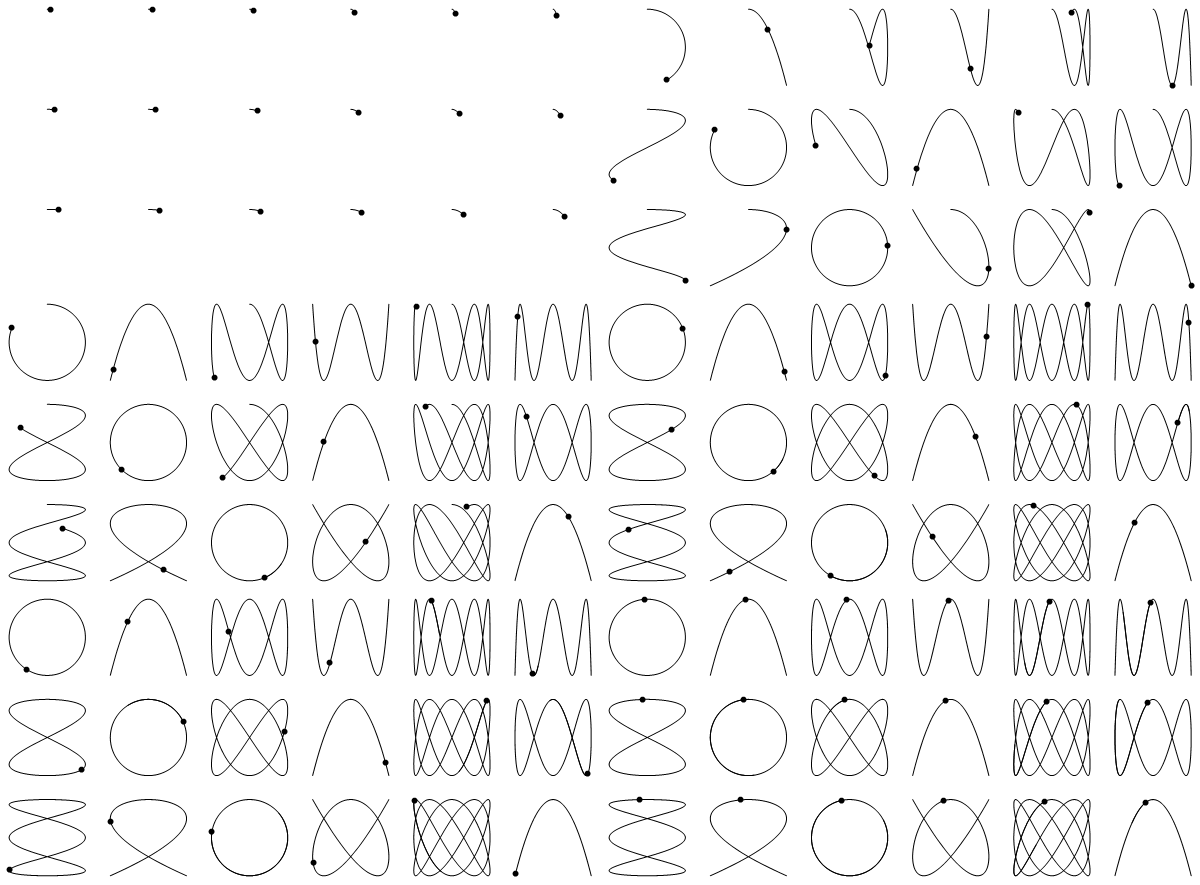
In order to get a smooth animation, I suggest setting the time step between the consecutive frames of the figure the same value as the "DisplayDurations" gif option. Since a human eye can distinguish about 10 frames per second, 0.1 [s] time period between frames seems to be a reasonable choice. Additionally, you will get "real-time" animation, where the Lissajous figures draw with its actual frequency.

Just a very minor modification to kglr code:

dt = 0.1;

   animatecurves2[cols_, rows_] := Module[{radius = 0.45}, 
   Table[GraphicsGrid[Table[ParametricPlot[{functionX[t, x], functionY[t, y]}, {t, 0,  n},
       Axes -> False, Frame -> False, 
       PlotRange -> {{-.55, .55}, {-.55, .55}}, PlotPoints -> 10, 
       PlotStyle -> Directive[{AbsoluteThickness[.5], Black}],
       MeshFunctions -> {#3 &}, Mesh -> {{n}}, 
       MeshStyle -> AbsolutePointSize[6]], {x, rows}, {y, cols}], 
       ImageSize -> 600], {n, 0.1, 4 Pi, dt}]]

glst = animatecurves2[6, 3];
Export["lsjcurves.gif", glst, AnimationRepetitions -> Infinity,
      "DisplayDurations" -> dt]

enter image description here

If You are not satisfied with the "animation speed", You can always speed it up, by shortening the "DisplayDurations" time. For example by a factor of two:

Export["lsjcurves.gif", glst, AnimationRepetitions -> Infinity,
          "DisplayDurations" -> dt/2]

enter image description here

EDIT:

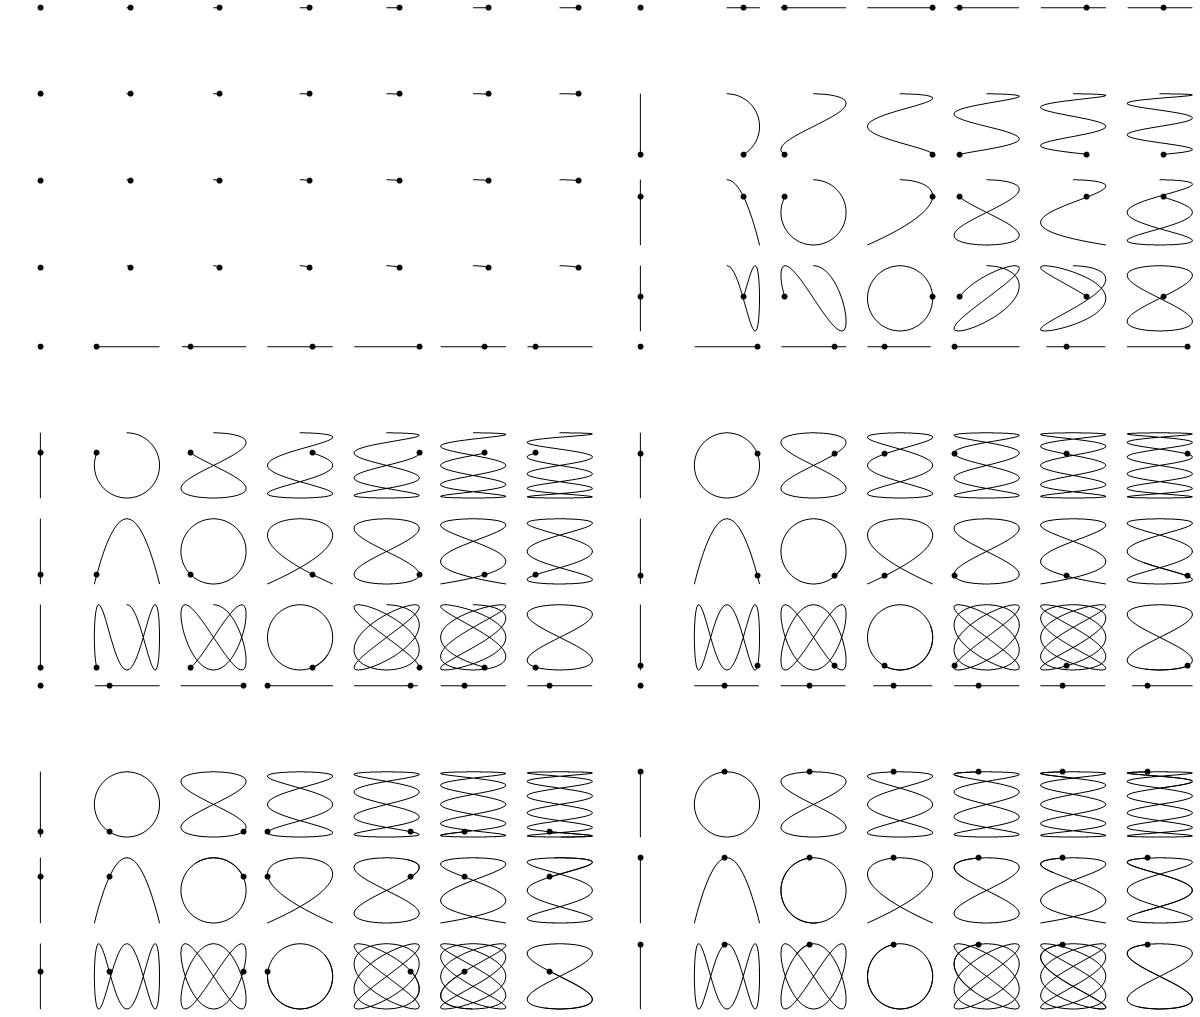
I have been playing with Your idea and found out that an interesting result can be obtained by switching frequency values ( x and y iterators) between rows and columns. As a result, moving points in one column are synchronised horizontally, and points in a row are moving with the same vertical pattern as well. Add "zero frequency" cases and You have an animation which explains the origin and mechanics of the Lissajous Curves!

 dt = 0.1;

       animatecurves2[cols_, rows_] := Module[{radius = 0.45}, 
       Table[GraphicsGrid[Table[ParametricPlot[{functionX[t, y], functionY[t, x]}, {t, 0,  n},
           Axes -> False, Frame -> False, 
           PlotRange -> {{-.55, .55}, {-.55, .55}}, PlotPoints -> 10, 
           PlotStyle -> Directive[{AbsoluteThickness[.5], Black}],
           MeshFunctions -> {#3 &}, Mesh -> {{n}}, 
           MeshStyle -> AbsolutePointSize[6]], {x, 0, rows}, {y, 0, cols}], 
           ImageSize -> 600], {n, 0.1, 4 Pi, dt}]]

    glst = animatecurves2[6, 3];

enter image description here

$\endgroup$
4
$\begingroup$

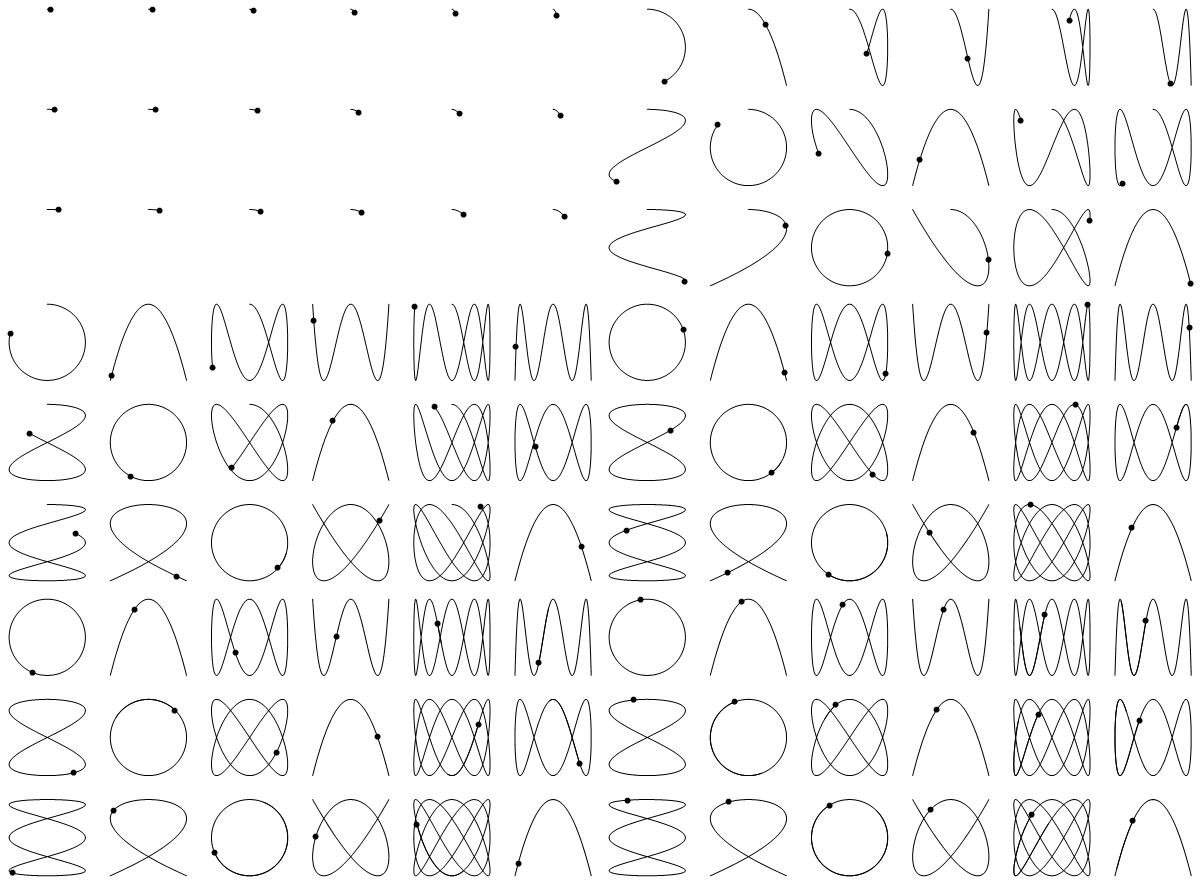
Using MeshFunctions instead of Epilog and increasing PlotRange (per Henrik's suggestion) and steps:

animatecurves2[cols_, rows_] := Module[{radius = 0.45, steps = 44}, 
  Table[GraphicsGrid[Table[ParametricPlot[{functionX[t, x], functionY[t, y]}, {t, 0,  n},
      Axes -> False, Frame -> False, 
      PlotRange -> {{-.55, .55}, {-.55, .55}}, PlotPoints -> 10, 
      PlotStyle -> Directive[{AbsoluteThickness[.5], Black}],
      MeshFunctions -> {#3 &}, Mesh -> {{n}}, 
      MeshStyle -> AbsolutePointSize[6]], {x, rows}, {y, cols}], 
    ImageSize -> 600], {n, 0.1, 4 Pi, 4 Pi/steps}]]

glst = animatecurves2[6, 3];
Export["lsjcurves.gif", glst, AnimationRepetitions -> Infinity,
  "DisplayDurations" -> ConstantArray[.2, Length@glst]]

enter image description here

$\endgroup$

Your Answer

By clicking “Post Your Answer”, you agree to our terms of service and acknowledge you have read our privacy policy.

Not the answer you're looking for? Browse other questions tagged or ask your own question.