8
$\begingroup$

I have used Manipulate in conjunction with Plot to draw a function's graph and I would like to show the current x-axis value and function value while hovering over the function's plot. How can I achieve this?

Thanks.

$\endgroup$
1
  • 2
    $\begingroup$ Is Tooltip any use? $\endgroup$
    – cormullion
    Commented Jan 10, 2013 at 7:57

2 Answers 2

9
$\begingroup$
Manipulate[
 Module[{tbl},
  tbl = Table[Tooltip[{x, Sin[a x]}], {x, -Pi, Pi, .1}];
  ListLinePlot[tbl, Mesh -> All, MeshStyle -> Opacity[0]]
  ],
 {{a, 1, "a?"}, .1, 5, .1}
 ]
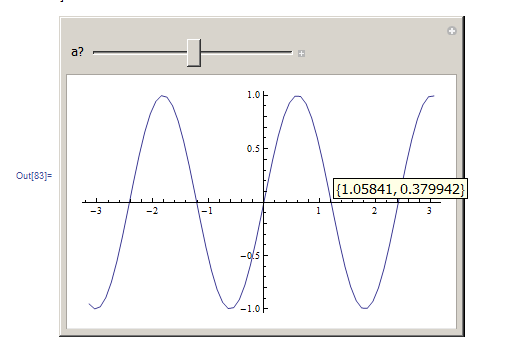
Mathematica graphics

$\endgroup$
3
  • $\begingroup$ Perfect! Thanks. $\endgroup$
    – dabd
    Commented Jan 10, 2013 at 11:10
  • $\begingroup$ Nice, straightforward coding and a result where the coordinates appear only when the cursor is on the curve. Only limitation is the granularity of the Tooltip iterator. $\endgroup$
    – murray
    Commented Jan 10, 2013 at 18:55
  • $\begingroup$ @dabd It would be considered gracious if you were to accept Nasser's solution (click the checkmark), since you consider it a good solution for you. $\endgroup$
    – Michael E2
    Commented Jan 10, 2013 at 19:49
10
$\begingroup$

Alternative that avoids the flicker of Tooltip (copying & adapting @Nasser):

f[x_, a_] := Sin[a x^3];
p = {0, 0};
Manipulate[
 EventHandler[
  Plot[f[x, a], {x, -Pi, Pi}, 
   Prolog -> Dynamic@{Thin, 
       Line[{{p[[1]], 0}, {p[[1]], f[ p[[1]], a]}, {0, f[ p[[1]], a]}}], 
       Point[{p[[1]], f[ p[[1]], a]}]}, 
   PlotLabel -> 
    Dynamic@{p[[1]], f[ p[[1]], a]}],
  {"MouseMoved" :> (p = If[# =!= None, #, p] &@MousePosition["Graphics"])}],
{{a, 1, "a?"}, .1, 5, .1}]
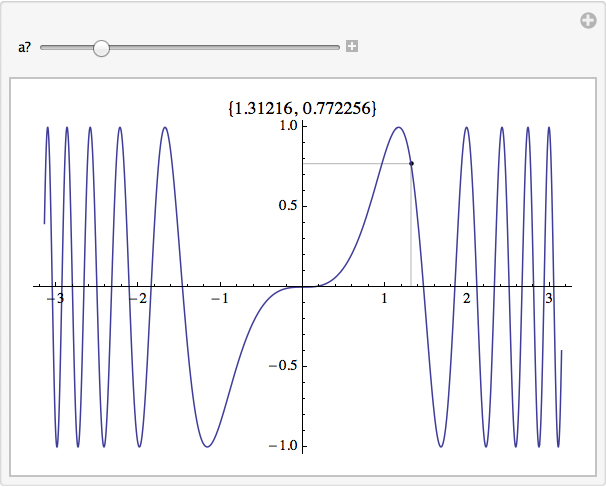
Manipulate output

It also takes advantage of Plot's adaptive graphing methods to deal with wiggly graphs.

$\endgroup$
4
  • $\begingroup$ Thanks, it looks interesting but I can't understand that code yet. $\endgroup$
    – dabd
    Commented Jan 10, 2013 at 17:53
  • $\begingroup$ +1 for showing the lines of projection onto the axes. But I don't like that you get a pair of coordinates even when the cursor isn't on the curve. $\endgroup$
    – murray
    Commented Jan 10, 2013 at 18:54
  • $\begingroup$ @murray Thanks. If asked, I could post a version in which the coordinates and projection lines disappear. It's more complicated - perhaps I don't know the best way - and the OP seems to like Nasser's straightforward solution. $\endgroup$
    – Michael E2
    Commented Jan 10, 2013 at 20:25
  • $\begingroup$ Yep, that's a dupe. I won't answer in that latest topic so feel free to include my comment into your answer there. ps. there is a nice syntax to keep last used coordinates after mouse exits: p = MousePosition["Graphics", p]. $\endgroup$
    – Kuba
    Commented Jul 14, 2016 at 20:36

Your Answer

By clicking “Post Your Answer”, you agree to our terms of service and acknowledge you have read our privacy policy.

Not the answer you're looking for? Browse other questions tagged or ask your own question.