2
$\begingroup$

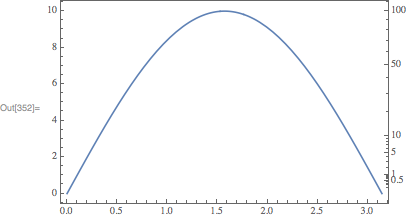
For a strictly increasing arbitrary function f[y], where y is the variable for the left hand side vertical axis(LHS) in the 2D plot, I wish to show its value using the vertical axis on the right hand side(RHS). (x will be the variable for the horizontal axis.)

As an example, I wish to show the value of f[y=1] using the coordinate value of the RHS vertical axis, and it should be ticked on the same height as y=1 in the LHS vertical axis.

Since f[y] will be an arbitrary function, its increasing rate will be arbitrary, and therefore the scale for the RHS vertical axis will not be uniform.

I have seen some examples where the scale for the RHS vertical axis is uniform, just like the LHS vertical axis. But I couldn't find any examples stated above. I want to ask if this type of plotting is achievable in Mathematica.

$\endgroup$

2 Answers 2

5
$\begingroup$

Is something like the following what you're looking for?

Plot[
    10 Sin[x],
    {x,0,Pi},
    Frame->True,
    FrameTicks->{
        {Automatic, Charting`ScaledTicks[{Sqrt[#]&, #^2&}]},
        {Automatic, None}
    }
]

enter image description here

$\endgroup$
2
  • 1
    $\begingroup$ Dear Carl, thank you for the answer! Yes this is what I am looking for, although I am not familiar with Charting`ScaledTicks at the moment. The example you kindly demonstrated is for f[y]=y^2. Is this type of plotting possible for any type of strictly increasing f[y], e.g., even for functions that are defined piece wise using Heaviside-theta functions that shows completely different behaviors depending on the y axis value? $\endgroup$
    – Gould67
    Commented Jan 25, 2018 at 6:40
  • $\begingroup$ I see. As long as I have numerically "good" definition of the inverse function, it works. Thank you! $\endgroup$
    – Gould67
    Commented Jan 25, 2018 at 9:38
0
$\begingroup$

If you do not want to frame your plot, and as sometimes it could be difficult to use undocumented functions, you can use AxesOrigin and custom Ticks:

ticks[xmin_, xmax_] := Table[{i, NumberForm[Sqrt[i], {2, 2}]}, {i, xmin, xmax}];
pl = Plot[10 Sin[x], {x, 0, Pi}, PlotRange -> {0, 10}, AxesOrigin -> {Pi + 0.2, 0.}, 
Ticks -> {Automatic, ticks}]

enter image description here

You can even modify the ticks marks if you do not want to they point outwards.

enter image description here

Or by using Frame but removing those unwanted axes:

ticks[xmin_, xmax_] := Table[{i, NumberForm[Sqrt[i], {2, 2}], {0, 0.005}}, {i, xmin, xmax}]; 
 Plot[10 Sin[x], {x, 0, Pi}, PlotRange -> {{0, \[Pi] + 0.2}, {0, 10}}, 
 Frame -> {{False, True}, {True, False}}, Axes -> False, 
 FrameTicks -> {{None, ticks}, {Automatic, None}}]

enter image description here

$\endgroup$

Your Answer

By clicking “Post Your Answer”, you agree to our terms of service and acknowledge you have read our privacy policy.

Not the answer you're looking for? Browse other questions tagged or ask your own question.