10
$\begingroup$

I'm trying to write a notebook that can take any square input image, and apply a cat map to it a specified number of times. I've written a pretty simple script that seems to work:

SetDirectory[NotebookDirectory[]];
M = {{1, 1}, {1, 2}};
CatMap[M_, x_, y_, n_, m_] := Mod[MatrixPower[M, m].{x, y}, n]
image = Import["cat1.jpg"];
n = ImageDimensions[image][[1]];
ImageResize[
 ImageTransformation[image, CatMap[M, #[[1]], #[[2]], n, 40] &, 
  DataRange -> Full], 300]

The image looks fine for a few iterations, but at some point, I just see a pattern of black and grey pixels. This demonstration has it working properly, but I can't figure out why that script works and mine doesn't. Here's the relevant code from the demonstration:

catMap = Compile[{{pic, _Integer, 2}}, 
   Table[pic[[Mod[x + y, 100, 1], Mod[x + 2 y, 100, 1]]], {x, 
     100}, {y, 100}]];poincarepic = 255 - Reverse[

poincarepic = 255 - Reverse[(*image pasted here*)[[1, 1]]];

Manipulate[
 ArrayPlot[Nest[catMap, poincarepic, iter], 
  Frame -> False], {{iter, 1, "iterations"}, 0, 150, 1, 
  Appearance -> "Labeled"}, SaveDefinitions -> True]

Any help would be greatly appreciated!

$\endgroup$
3
  • $\begingroup$ I don't understand what you mean by "image pasted here" because images are atomic (e.g. parts cannot be selected). It will cause an error. $\endgroup$
    – C. E.
    Commented Jan 19, 2018 at 17:06
  • $\begingroup$ I just added that commented section because that's where the image was inserted in the original code. I'm not sure how the code works exactly but it seems like it operates on the matrix of pixel values for the image. $\endgroup$ Commented Jan 19, 2018 at 18:41
  • $\begingroup$ Ok, it could be that it worked in a previous version of Mathematica. $\endgroup$
    – C. E.
    Commented Jan 20, 2018 at 12:44

3 Answers 3

10
$\begingroup$

I think your problem is machine precision: ImageTransformation passes machine precision values to your function, so the calculation is done using finite-precision floating point numbers. For large m, the least significant bits wont be accurate, and Mod[..., n] will return rounding artifacts, or 0.

You can convert the floating point numbers to integers using Floor, then the calculation will use integers, and you won't have precision/rounding issues:

m = 40;
mp = MatrixPower[M, m];
CatMap[M_, xy_, n_] := Mod[mp.xy, n]

ImageTransformation[img, (CatMap[M, Floor[#], n]) &, 
  DataRange -> Full, PlotRange -> Full] // AbsoluteTiming

(I changed your code so MatrixPower is only called once, instead of once per pixel, to make it a bit faster)

Sidenote: For small m, you can improve speed a lot by using floating point algebra and Padding -> "Periodic" instead of Mod. This is about 30× faster on my PC, so calling this 4 times in a row should give the same result and will still be faster:

ImageTransformation[img, AffineTransform[MatrixPower[M, 10]], 
 Padding -> "Periodic"]
$\endgroup$
2
  • $\begingroup$ Thanks for the quick response! I had tried applying the Round[] function to the arguments of CatMap after reading a solution to a similar problem, but was not having any success. This works great! What I'd like to do now is to make a slideshow out of all the iterations in a given range for the value "m". I'll try wrapping everything in a Do[] structure and see how that goes. $\endgroup$ Commented Jan 19, 2018 at 18:51
  • $\begingroup$ Maybe NestList will be useful to produce a list of iterations. $\endgroup$ Commented Jan 19, 2018 at 19:18
8
$\begingroup$

Niki has already solved the problem with OP's code, but it would be nice to see some pictures as well. I will illustrate the chaos and recurrence that Arnold's cat map is famous for with an alternative implementation.

We shall be using this site's logo as our cat image:

img = Import["https://i.sstatic.net/yjrEY.png"];
img = ImagePad[img, {{0, 0}, {4, 4}}, White];

Mathematica graphics

The dimension of this image is 300 by 300. We will need to apply the map to each pixel index $(x,y)$ separately. We define the map and get the grid of pixel indices like this:

catMap[n_][{x_, y_}] := Mod[{{1, 1}, {1, 2}}.{x, y}, n, 1]
coords = Array[List, ImageDimensions[img]];

The third argument of Mod accounts for the fact that indices start at 1. The cat map has a parameter $N$, which I will take to be 300:

n = First[ImageDimensions[img]];

We apply the map to each coordinate over and over again until we retrieve the coordinates that we started with:

newCoords = NestWhileList[
   Map[catMap[n], #, {2}] &
   , coords
   , # != coords &
   , {2, 1}
   ];

This is a method that works without us having to know beforehand how many times we have to apply the map to retrieve the original coordinates. In this case, it turns out we need to apply the map 300 times, same as our $N$.

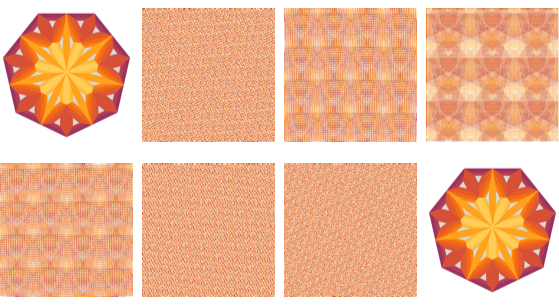
Now I'll select eight of the 301 matrices and visualize those as images, using pixel values from the original image. For example, if the element at $(1,1)$ in our coordinates matrix is $(5, 20)$, then I'll set the pixel value at $(1,1)$ to the pixel value at $(5, 20)$ in the original image:

frames = Part[newCoords, {1, 51, 101, 151, 201, 251, 275, 301}];
pixels = ImageData[img];

draw[coords_, pixels_] := Image[
   Map[Extract[pixels, #] &, coords, {2}]
   , ColorSpace -> "RGB"
   ];

Partition[draw[#, pixels] & /@ frames, 4] // Grid

Mathematica graphics

Frame 301 is the same as frame 1, as we knew it would be. The images in between are noisy, although some of them have patterns reminiscent of the original image.

$\endgroup$
2
  • $\begingroup$ Such graphics are nice to look at. But to better understand what the "cat map" does, it may be better to use a simpler, outline, image -- such as the simple cat's face to which Arnold and Avez (cited on the Wikipedia page linked in the question) apply iterates of the "baker's transformation". $\endgroup$
    – murray
    Commented Jan 21, 2018 at 17:08
  • $\begingroup$ @murray Agreed, I don't try to explain how it works in this answer. I focus on the Mathematica aspects of how to apply the map and how to visualize it. $\endgroup$
    – C. E.
    Commented Jan 21, 2018 at 19:49
0
$\begingroup$

For completeness, here is the image that was used in the Demonstration linked in the OP:

img = Import["https://i.sstatic.net/AHzgz.png"];
dim = First[ImageDimensions[img]];

The Manipulate[] can now be done very simply:

Manipulate[Image[ImageTransformation[img, 
                 Nest[({1, -1} Mod[{{2, -1}, {1, -1}}.#, dim] + {0, dim}) &, #, iter] &,
                 DataRange -> Full], ImageSize -> Max[dim, 400]],
           {{iter, 1, "iterations"}, 0, dim + Quotient[dim, 2], 1,
            Appearance -> "Labeled"}, SaveDefinitions -> True]

Note that I had to modify the definition for the cat map slightly to account for the image's coordinate system, which is the format needed by ImageTransformation[]. You can try other images, e.g. img = ImageResize[ExampleData[{"AerialImage", "Pentagon"}], {200, 200}];.

$\endgroup$

Your Answer

By clicking “Post Your Answer”, you agree to our terms of service and acknowledge you have read our privacy policy.

Not the answer you're looking for? Browse other questions tagged or ask your own question.