Note: The following needs a properly color quantized image as input. Color quantization for general images is a problem on its own that depends on many factors and is not addressed below.
First we will go step by step, then wrapping up all of it in a function:
Import some discrete-colored image:
ii = Import["https://i.sstatic.net/9vdgV.png"]

Then we find the list of colors in that image:
ru = Union@Flatten[ImageData@ii, 1]
(* {{1., 0., 0., 1.}, {1., 0.882353, 0., 1.}} *)
For each color we separate in different binary images
selCol[i_Image, col_] := ImageApply[1 - Unitize@Tr[# - col] &, i]
cols = selCol[ii, #] & /@ ru

Now, for each of these images we separate the Morphological Components and we form a new array where each of them is represented by a different number. Perhaps there is an easier way, but the following works:
cs = Fold[#1 + Unitize@#2 Max@#1 + #2 &,  MorphologicalComponents/@ cols];
Colorize@cs

For each component we need its neighbors to build up the edges:
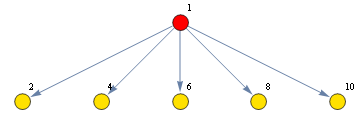
nei = ComponentMeasurements[cs, "Neighbors"]
(* {1 -> {2, 4, 6, 8, 10}, 2 -> {1}, 4 -> {1}, 6 -> {1}, 8 -> {1}, 10 -> {1}} *)
And so we build our edges:
edges = DeleteDuplicates[Sort /@ Union @@ Thread /@ nei]
(* {1 -> 2, 1 -> 4, 1 -> 6, 1 -> 8, 1 -> 10} *)
Finally, for coloring the vertex we want to recover which color in the original image correspond to each vertex number:
ucs = Union@Flatten@cs;
colCorr = Extract[ImageData[ii], #] & /@ Position[cs, #, 2, 1] & /@ ucs
(* {{{1., 0., 0., 1.}}, {{1., 0.882353, 0., 1.}}, {{1., 0.882353, 0., 1.}},
    {{1., 0.882353, 0., 1.}}, {{1., 0.882353, 0., 1.}}, {{1., 0.882353, 0., 1.}}}
*)
we now build the vertex coloring rules:
vStyle = Thread[ Rule[ucs, RGBColor @@@ Flatten[colCorr, 1]]]
(*
{1 -> RGBColor[1., 0., 0., 1.],
 2 -> RGBColor[1., 0.882353, 0., 1.],
 4 -> RGBColor[1., 0.882353, 0., 1.],
 6 -> RGBColor[1., 0.882353, 0., 1.],
 8 -> RGBColor[1., 0.882353, 0., 1.],
 10 -> RGBColor[1., 0.882353, 0., 1.]}
 *)
And finally the Graph:
Graph[edges, VertexSize -> 0.2, VertexStyle -> vStyle, VertexLabels -> "Name"]

So now we will pack it into one function:
mkDual[ii_Image, OptionsPattern[{CornerNeighbors -> False}]] :=
 Module[{selCol, ru, cols, cs, nei, edges, ucs, colCorr, vStyle},
  selCol[i_Image, col_] := ImageApply[1 - Unitize@Tr[# - col] &, i];
  ru = Union@Flatten[ImageData@ii, 1];
  cols = selCol[ii, #] & /@ ru;
  cs = Fold[#1 + Unitize@#2 Max@#1 + #2 &,  MorphologicalComponents[#,
                    CornerNeighbors -> OptionValue[CornerNeighbors]] & /@ cols];
  nei = ComponentMeasurements[cs, "Neighbors"];
  edges = DeleteDuplicates[Sort /@ Union @@ Thread /@ nei];
  ucs = Union@Flatten@cs;
  colCorr = Extract[ImageData[ii], #] & /@ Position[cs, #, 2, 1] & /@ ucs;
  vStyle = Thread[Rule[ucs, RGBColor @@@ Flatten[colCorr, 1]]];
  Graph[edges, VertexSize -> 0.2, VertexStyle -> vStyle, VertexLabels -> "Name"]]
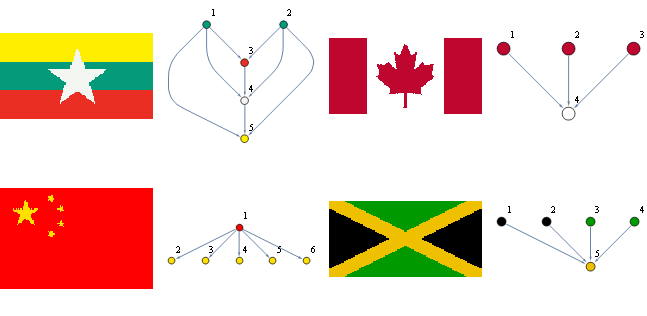
and use it on color-quantized images of some country flags
riq = Import /@
       {"https://i.sstatic.net/TqpFO.png","https://i.sstatic.net/ZQwSA.png",
        "https://i.sstatic.net/SyIt7.png","https://i.sstatic.net/g334k.png",
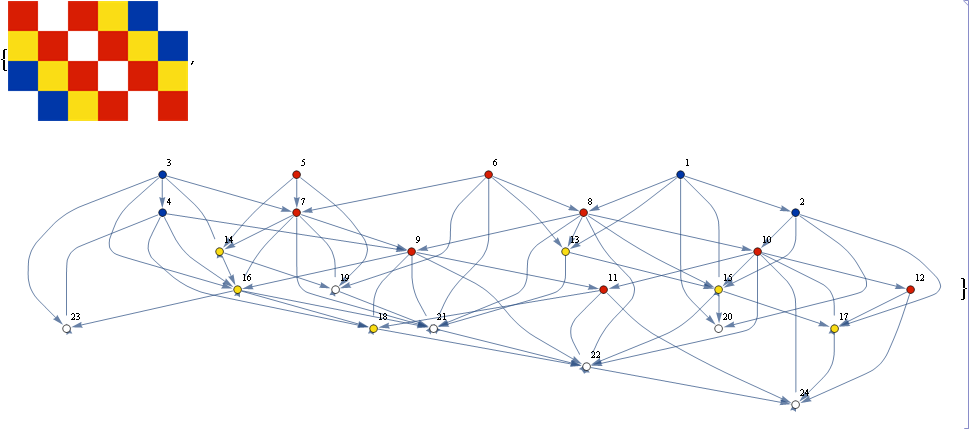
        "http://3.bp.blogspot.com/-vRxXWRa_4zk/UXz62fD9wRI/AAAAAAAAAs8/9bFvYHh8ozg/s1600/Antwerp+Flag.png"};
GraphicsGrid@Partition[Flatten[{#, mkDual[#, CornerNeighbors -> True]} & /@ riq[[1 ;; 4]]],  2]

{#, mkDual[#, CornerNeighbors -> False]} &@riq[[5]]


