6
$\begingroup$

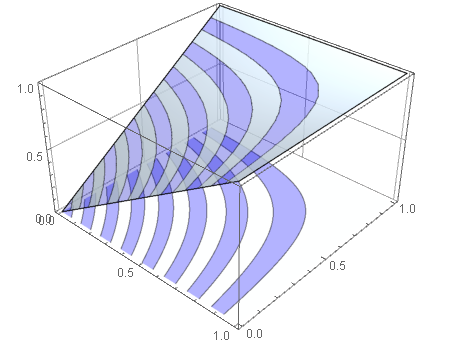
I use this code to draw three-dimensional surfaces and show the curves at the bottom. But does not give me the result required:

u[x_, y_] := x + y - x y
contour = 
  ContourPlot[u[x, y], {x, 0, 1}, {y, 0, 1}, PlotRange -> {0, 1}, 
   Axes -> False, Contours -> 15, PlotPoints -> 50, 
   PlotRangePadding -> 0, 
   ContourShading -> {{Opacity[.3], Blue}, {Opacity[.8], LightBlue}}];
potential1 = 
  Plot3D[u[x, y], {x, 0, 1}, {y, 0, 1}, PlotRange -> {0, 1}, 
   ClippingStyle -> None, MeshFunctions -> {#3 &}, Mesh -> 15, 
   MeshStyle -> Opacity[.5], 
   MeshShading -> {{Opacity[.3], Blue}, {Opacity[.8], LightBlue}}, 
   PlotRange -> {Automatic, Automatic, {min, 2}}, 
   Lighting -> "Neutral"];
Show[potential1, 
 Graphics3D[contour[[1]] /. {x_Real, y_Real} :> {x, y, 0}], 
 BoxRatios -> {1, 1, 0.6}, FaceGrids -> {Back, Left}]

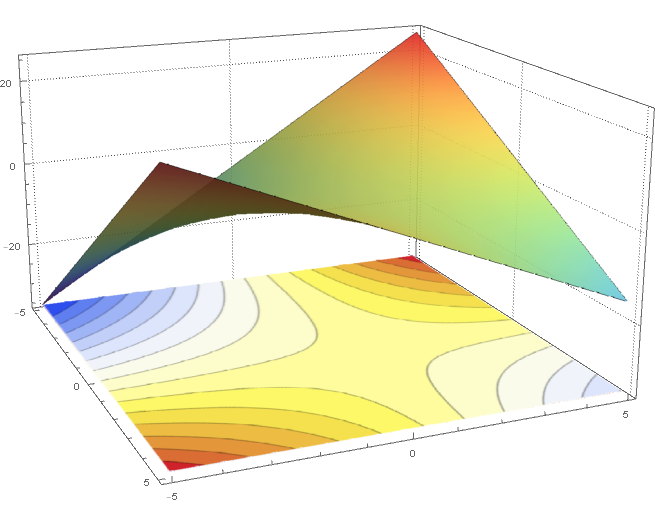
enter image description here

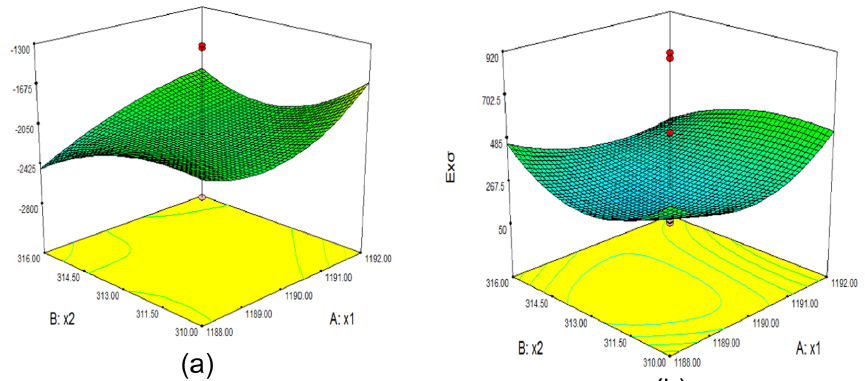
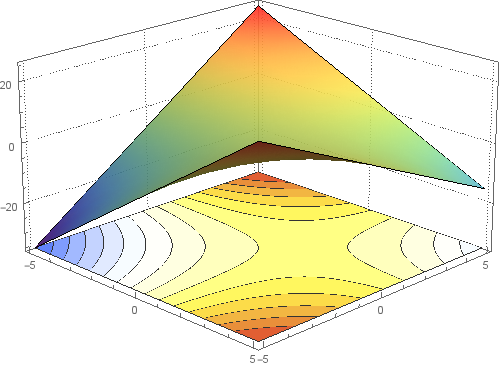
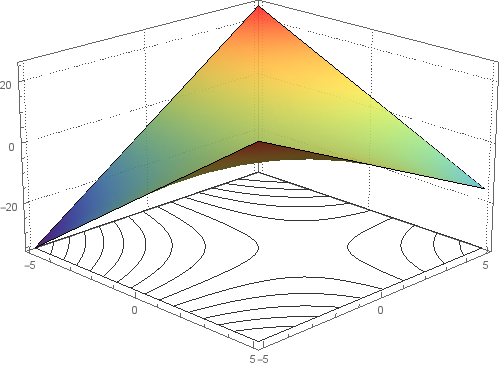
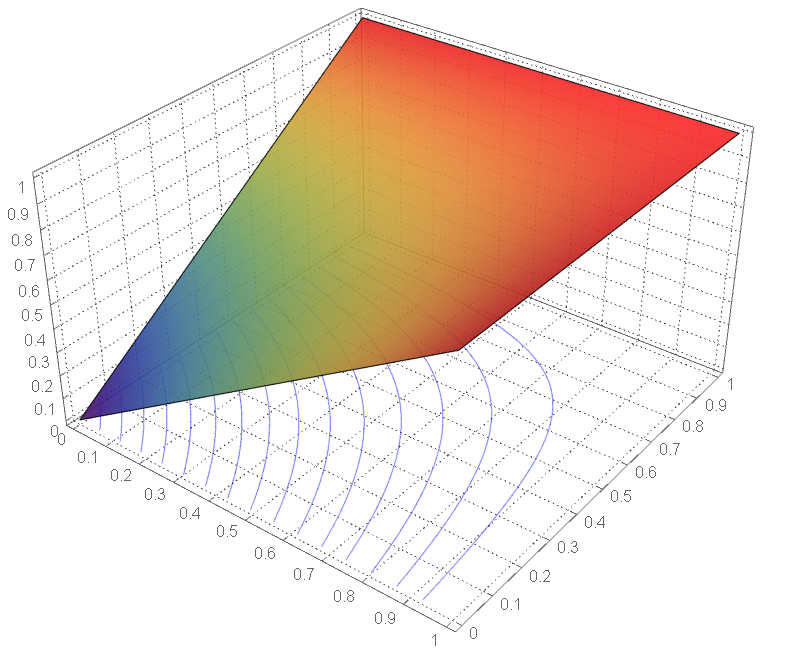
I need to have a three-dimensional drawing (Plot3D) that shows curves only better as in the following figures: enter image description here enter image description here
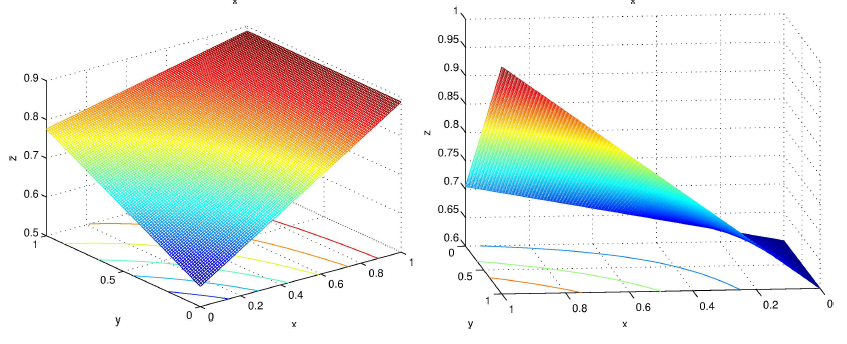
Is there a similar result to this plotting as in the pictures?

Or it's in other programs?

My attempts

contourPotentialPlot1 = 
  ContourPlot[x + y - x y, {x, -5, 5}, {y, -5, 5}, Contours -> 15, 
   Axes -> False, PlotPoints -> 30, PlotRangePadding -> 0, 
   Frame -> False, ColorFunction -> "DarkRainbow"];

potential1 = 
  Plot3D[x + y - x y, {x, -5, 5}, {y, -5, 5}, ClippingStyle -> None, 
   Mesh -> None, ColorFunction -> Function[{x, y, z}, Hue[z]], 
   PlotTheme -> "Detailed"];
level = -40; gr = 
 Graphics3D[{Texture[contourPotentialPlot1], EdgeForm[], 
   Polygon[{{-5, -5, level}, {5, -5, level}, {5, 5, level}, {-5, 5, 
      level}}, 
    VertexTextureCoordinates -> {{0, 0}, {1, 0}, {1, 1}, {0, 1}}]}, 
  Lighting -> "Neutral"];

Show[potential1, gr, PlotRange -> All, BoxRatios -> {1, 1, .6}, 
 FaceGrids -> {Back, Left}]

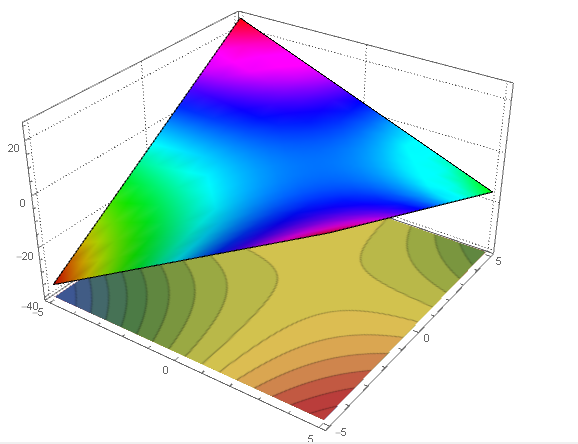
enter image description here

pts = Append[#, level] & /@ contourPotentialPlot1[[1, 1]];
cts = Cases[contourPotentialPlot1, Line[l_], Infinity];
cts3D = Graphics3D[GraphicsComplex[pts, {Opacity[.5], cts}]];
Show[potential1, cts3D, PlotRange -> All, BoxRatios -> {1, 1, .6}, 
 FaceGrids -> {Bottom, Back, Left}]

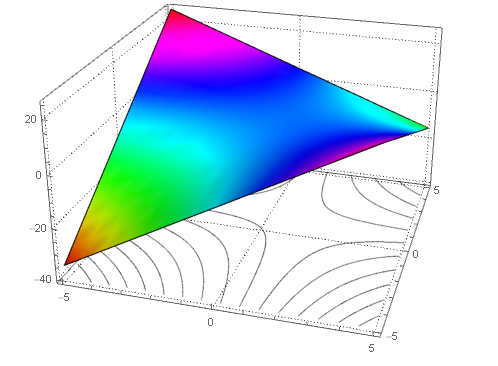
enter image description here

This is pretty good. Can this code be improved or modified?

Thanks for the help.

$\endgroup$
2
  • $\begingroup$ Probably this is what you are after! $\endgroup$ Commented Aug 23, 2017 at 19:40
  • $\begingroup$ @PlatoManiac This gives a good result but z-axis is not equal $\endgroup$ Commented Aug 23, 2017 at 20:55

4 Answers 4

5
$\begingroup$

In versions 10.2+, you can use SliceContourPlot3D

potential1 = Plot3D[x + y - x y, {x, -5, 5}, {y, -5, 5}, 
 ClippingStyle -> None, Mesh -> None, ColorFunction -> (ColorData["Rainbow"][#3] &), 
 PlotStyle -> Directive[Opacity[0.9]], PlotTheme -> "Detailed"];

We can use PlotRange[potential1] to get the x, y, and z ranges.

{xrange, yrange, zrange} = PlotRange[potential1];

contours = SliceContourPlot3D[x + y - x y, z == zrange[[1]], 
  {x, xrange[[1]], xrange[[2]]}, 
  {y, yrange[[1]], yrange[[2]]}, {z, zrange[[1]], zrange[[2]]}, 
  Contours -> 15,  PlotPoints -> 50, ColorFunction -> "TemperatureMap"];

Show[potential1, contours, 
  ImageSize -> 500, Lighting -> "Neutral", 
  PlotRange -> All, BoxRatios -> {1, 1, .6}, 
  FaceGrids -> {Back, Left}, ViewPoint -> {4, -4, 2}]

enter image description here

Update:

I need ContourPlot3D be transparent, Only curves appear

Use ContourShading -> None or ContourShading -> Opacity[0] (and remove ColorFunction-> "TemperatureMap") in SliceContourPlot3D to get

enter image description here

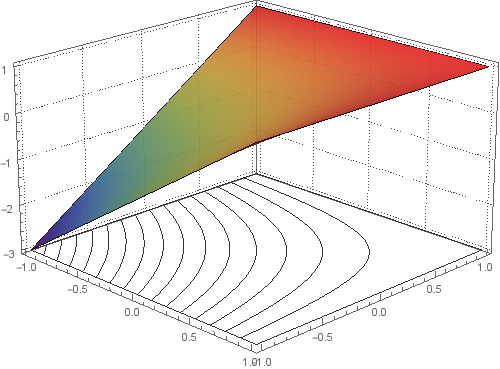
If I changed range of x,y∈[0,1] does not give the desired result

This is what I get when I use {x, 0, 1} and {y, 0, 1} in both Plot3D and SliceContourPlot3D:

enter image description here

$\endgroup$
3
  • $\begingroup$ Thank you so much , I need ContourPlot3D be transparent , Only curves appear $\endgroup$ Commented Aug 23, 2017 at 22:14
  • $\begingroup$ If I changed range of $ x , y \in [0,1]$ does not give the desired result $\endgroup$ Commented Aug 23, 2017 at 22:22
  • $\begingroup$ @Emad, please see the update. $\endgroup$
    – kglr
    Commented Aug 23, 2017 at 22:33
5
$\begingroup$

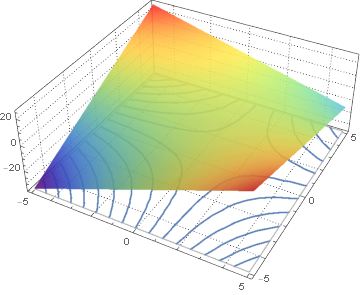
Here is a method that uses only Plot3D[] with its MeshFunctions option, and achieves the desired result with a little post-processing:

p1 = Normal[Plot3D[x + y - x y, {x, -5, 5}, {y, -5, 5}, 
                   BoundaryStyle -> Directive[GrayLevel[2/3], AbsoluteThickness[1]], 
                   ClippingStyle -> None, ColorFunction -> "Rainbow", 
                   MeshFunctions -> {#3 &},
                   MeshStyle -> Directive[AbsoluteThickness[1.6], ColorData[97, 1]], 
                   PlotStyle -> Opacity[0.9], PlotTheme -> "Detailed"]];
tr = AffineTransform[{DiagonalMatrix[{1, 1, 0}], {0, 0, PlotRange[p1][[-1, 1]]}}];

p1 /. Line[l_] :> Line[tr @ l]

surface and projected contours

$\endgroup$
4
$\begingroup$

To get the correct z-axis I will do just the following. I get the z-axis value from the PlotRange option of the Plot3D and set level to that value.

level = First@Last@(PlotRange /. AbsoluteOptions[potential1, PlotRange]);

All should be fine after that. enter image description here

Updated version of your code:

contourPotentialPlot1 = 
  ContourPlot[x + y - x y, {x, -5, 5}, {y, -5, 5}, Contours -> 15, 
   Axes -> False, PlotPoints -> 30, PlotRangePadding -> 0, 
   Frame -> False, ColorFunction -> "TemperatureMap"];
potential1 = 
  Plot3D[x + y - x y, {x, -5, 5}, {y, -5, 5}, ClippingStyle -> None, 
   Mesh -> None, ColorFunction -> (ColorData["Rainbow"][#3] &), 
   PlotStyle -> Directive[Opacity[0.9]], PlotTheme -> "Detailed"];
level = First@
  Last@(PlotRange /. AbsoluteOptions[potential1, PlotRange]);
gr = 
 Graphics3D[{Texture[contourPotentialPlot1], EdgeForm[], 
   Polygon[{{-5, -5, level}, {5, -5, level}, {5, 5, level}, {-5, 5, 
      level}}, 
    VertexTextureCoordinates -> {{0, 0}, {1, 0}, {1, 1}, {0, 1}}]}, 
  Lighting -> "Neutral"];
Show[potential1, gr, PlotRange -> All, BoxRatios -> {1, 1, .6}, 
 FaceGrids -> {Back, Left}]
$\endgroup$
3
  • $\begingroup$ Thank you so much. I have a question how to divide the axis period, for example, $\{-5,-4,-2,...,4.5\}$ $\endgroup$ Commented Aug 23, 2017 at 21:47
  • $\begingroup$ @Emadkareem Check Ticks in documentation. $\endgroup$ Commented Aug 23, 2017 at 22:17
  • $\begingroup$ I need ContourPlot3D be transparent , Only curves appear, If I changed range of $ x , y \in [0,1]$ does not give the desired result $\endgroup$ Commented Aug 23, 2017 at 22:22
0
$\begingroup$

This answer gives the result very close to the pictures in question depending on some of the answers

p1 = ContourPlot[x + y - x y, {x, 0, 1}, {y, 0, 1}, Contours -> 15, 
   ContourShading -> None];
p2 = Plot3D[x + y - x y, {x, 0, 1}, {y, 0, 1}, ClippingStyle -> None, 
   Mesh -> None, ColorFunction -> (ColorData["Rainbow"][#3] &), 
   PlotStyle -> Directive[Opacity[0.9]], 
   Ticks -> {{0, .1, .2, .3, .4, .5, .6, .7, .8, .9, 
      1}, {0, .1, .2, .3, .4, .5, .6, .7, .8, .9, 1}}, 
   ImageSize -> Large, PlotTheme -> "Detailed"];
level = First@Last@(PlotRange /. AbsoluteOptions[p2, PlotRange]);
gr = Graphics3D[{Texture[p1], EdgeForm[], 
    Polygon[{{{0, 0, 0}, {1, 0, 0}, {1, 1, 0}, {0, 1, 0}}}, 
     VertexTextureCoordinates -> {{0, 0}, {1, 0}, {1, 1}, {0, 1}}]}, 
   Lighting -> "Neutral"];
pts = Append[#, level] & /@ p1[[1, 1]];
cts = Cases[p1, Line[l_], Infinity];
cts3D = Graphics3D[GraphicsComplex[pts, {Opacity[.5], {Blue, cts}}]];
Show[p2, cts3D, PlotRange -> All, BoxRatios -> {1, 1, .6}, 
 FaceGrids -> {{{0, 1, 0}, {Range[0, 1, 0.1], 
     Range[0, 1, 0.1]}}, {{-1, 0, 0}, {Range[0, 1, 0.1], 
     Range[0, 1, 0.1]}}, {{0, 0, -1}, {Range[0, 1, 0.1], 
     Range[0, 1, 0.1]}}}, ImageSize -> Large, PlotTheme -> "Detailed"]

enter image description here

$\endgroup$

Your Answer

By clicking “Post Your Answer”, you agree to our terms of service and acknowledge you have read our privacy policy.

Not the answer you're looking for? Browse other questions tagged or ask your own question.