deleted 2 characters in body
Source Link

In versions 10.2+, you can use SlicedContourPlot3DSliceContourPlot3D

potential1 = Plot3D[x + y - x y, {x, -5, 5}, {y, -5, 5}, 
 ClippingStyle -> None, Mesh -> None, ColorFunction -> (ColorData["Rainbow"][#3] &), 
 PlotStyle -> Directive[Opacity[0.9]], PlotTheme -> "Detailed"];

We can use PlotRange[potential1] to get the x, y, and z ranges.

{xrange, yrange, zrange} = PlotRange[potential1];

contours = SliceContourPlot3D[x + y - x y, z == zrange[[1]], 
  {x, xrange[[1]], xrange[[2]]}, 
  {y, yrange[[1]], yrange[[2]]}, {z, zrange[[1]], zrange[[2]]}, 
  Contours -> 15,  PlotPoints -> 50, ColorFunction -> "TemperatureMap"];

Show[potential1, contours, 
  ImageSize -> 500, Lighting -> "Neutral", 
  PlotRange -> All, BoxRatios -> {1, 1, .6}, 
  FaceGrids -> {Back, Left}, ViewPoint -> {4, -4, 2}]

enter image description here

Update:

I need ContourPlot3D be transparent, Only curves appear

Use ContourShading -> None or ``ContourShading -> Opacity[0]  (andContourShading remove-> Opacity[0]ColorFunction-> "TemperatureMap" (and remove ) inColorFunction-> "TemperatureMap"SliceContourPlot3D`) in SliceContourPlot3D to get

enter image description here

If I changed range of x,y∈[0,1] does not give the desired result

This is what I get when I use {x, 0, 1} and {y, 0, 1} in both Plot3D and SliceContourPlot3D:

enter image description here

In versions 10.2+, you can use SlicedContourPlot3D

potential1 = Plot3D[x + y - x y, {x, -5, 5}, {y, -5, 5}, 
 ClippingStyle -> None, Mesh -> None, ColorFunction -> (ColorData["Rainbow"][#3] &), 
 PlotStyle -> Directive[Opacity[0.9]], PlotTheme -> "Detailed"];

We can use PlotRange[potential1] to get the x, y, and z ranges.

{xrange, yrange, zrange} = PlotRange[potential1];

contours = SliceContourPlot3D[x + y - x y, z == zrange[[1]], 
  {x, xrange[[1]], xrange[[2]]}, 
  {y, yrange[[1]], yrange[[2]]}, {z, zrange[[1]], zrange[[2]]}, 
  Contours -> 15,  PlotPoints -> 50, ColorFunction -> "TemperatureMap"];

Show[potential1, contours, 
  ImageSize -> 500, Lighting -> "Neutral", 
  PlotRange -> All, BoxRatios -> {1, 1, .6}, 
  FaceGrids -> {Back, Left}, ViewPoint -> {4, -4, 2}]

enter image description here

Update:

I need ContourPlot3D be transparent, Only curves appear

Use ContourShading -> None or ``ContourShading -> Opacity[0](and removeColorFunction-> "TemperatureMap") in SliceContourPlot3D` to get

enter image description here

If I changed range of x,y∈[0,1] does not give the desired result

This is what I get when I use {x, 0, 1} and {y, 0, 1} in both Plot3D and SliceContourPlot3D:
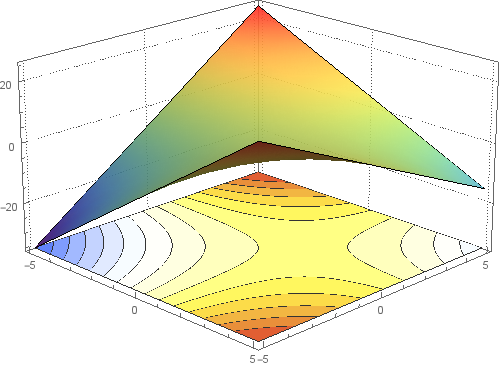
enter image description here

In versions 10.2+, you can use SliceContourPlot3D

potential1 = Plot3D[x + y - x y, {x, -5, 5}, {y, -5, 5}, 
 ClippingStyle -> None, Mesh -> None, ColorFunction -> (ColorData["Rainbow"][#3] &), 
 PlotStyle -> Directive[Opacity[0.9]], PlotTheme -> "Detailed"];

We can use PlotRange[potential1] to get the x, y, and z ranges.

{xrange, yrange, zrange} = PlotRange[potential1];

contours = SliceContourPlot3D[x + y - x y, z == zrange[[1]], 
  {x, xrange[[1]], xrange[[2]]}, 
  {y, yrange[[1]], yrange[[2]]}, {z, zrange[[1]], zrange[[2]]}, 
  Contours -> 15,  PlotPoints -> 50, ColorFunction -> "TemperatureMap"];

Show[potential1, contours, 
  ImageSize -> 500, Lighting -> "Neutral", 
  PlotRange -> All, BoxRatios -> {1, 1, .6}, 
  FaceGrids -> {Back, Left}, ViewPoint -> {4, -4, 2}]

enter image description here

Update:

I need ContourPlot3D be transparent, Only curves appear

Use ContourShading -> None or   ContourShading -> Opacity[0] (and remove ColorFunction-> "TemperatureMap") in SliceContourPlot3D to get

enter image description here

If I changed range of x,y∈[0,1] does not give the desired result

This is what I get when I use {x, 0, 1} and {y, 0, 1} in both Plot3D and SliceContourPlot3D:
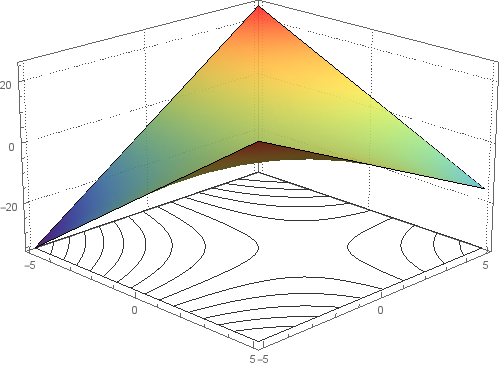
enter image description here

added 92 characters in body
Source Link
kglr
  • 400.5k
  • 18
  • 488
  • 929

In versions 10.2+, you can use SlicedContourPlot3D

potential1 = Plot3D[x + y - x y, {x, -5, 5}, {y, -5, 5}, 
 ClippingStyle -> None, Mesh -> None, ColorFunction -> (ColorData["Rainbow"][#3] &), 
 PlotStyle -> Directive[Opacity[0.9]], PlotTheme -> "Detailed"];

We can use PlotRange[potential1] to get the x, y, and z ranges.

{xrange, yrange, zrange} = PlotRange[potential1][[-1]];PlotRange[potential1];

contours = SliceContourPlot3D[x + y - x y, z == zrange[[1]], 
   {x, -5xrange[[1]], 5xrange[[2]]}, 
  {y, -5yrange[[1]], 5yrange[[2]]}, {z, zrange[[1]], zrange[[2]]}, 
   Contours -> 15,  PlotPoints -> 50, ColorFunction -> "TemperatureMap"];

Show[potential1, contours, 
  ImageSize -> 500, Lighting -> "Neutral", 
  PlotRange -> All, BoxRatios -> {1, 1, .6}, 
  FaceGrids -> {Back, Left}, ViewPoint -> {4, -4, 2}]

enter image description here

Update:

I need ContourPlot3D be transparent, Only curves appear

Use ContourShading -> None (and removeor ``ContourShading -> Opacity[0]ColorFunction->(and "TemperatureMap"remove) in ColorFunction-> "TemperatureMap"SliceContourPlot3D) in SliceContourPlot3D` to get

enter image description here

If I changed range of x,y∈[0,1] does not give the desired result

This is what I get when I use {x, 0, 1} and {y, 0, 1} in both Plot3D and SliceContourPlot3D:
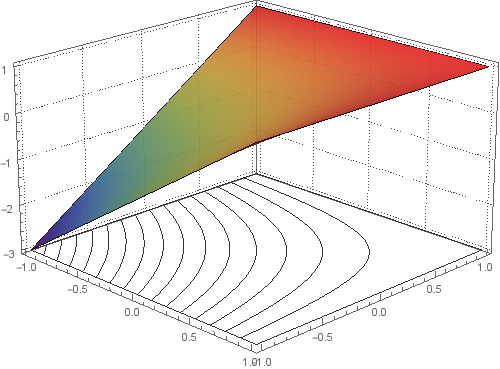
enter image description here

In versions 10.2+, you can use SlicedContourPlot3D

potential1 = Plot3D[x + y - x y, {x, -5, 5}, {y, -5, 5}, 
 ClippingStyle -> None, Mesh -> None, ColorFunction -> (ColorData["Rainbow"][#3] &), 
 PlotStyle -> Directive[Opacity[0.9]], PlotTheme -> "Detailed"];

We can use PlotRange[potential1] to get the x, y, and z ranges.

zrange = PlotRange[potential1][[-1]];

contours = SliceContourPlot3D[x + y - x y, z == zrange[[1]], 
   {x, -5, 5}, {y, -5, 5}, {z, zrange[[1]], zrange[[2]]}, 
   Contours -> 15,  PlotPoints -> 50, ColorFunction -> "TemperatureMap"];

Show[potential1, contours, 
  ImageSize -> 500, Lighting -> "Neutral", 
  PlotRange -> All, BoxRatios -> {1, 1, .6}, 
  FaceGrids -> {Back, Left}, ViewPoint -> {4, -4, 2}]

enter image description here

Update:

I need ContourPlot3D be transparent, Only curves appear

Use ContourShading -> None (and remove ColorFunction-> "TemperatureMap") in SliceContourPlot3D to get

enter image description here

If I changed range of x,y∈[0,1] does not give the desired result

This is what I get when I use {x, 0, 1} and {y, 0, 1} in both Plot3D and SliceContourPlot3D:

enter image description here

In versions 10.2+, you can use SlicedContourPlot3D

potential1 = Plot3D[x + y - x y, {x, -5, 5}, {y, -5, 5}, 
 ClippingStyle -> None, Mesh -> None, ColorFunction -> (ColorData["Rainbow"][#3] &), 
 PlotStyle -> Directive[Opacity[0.9]], PlotTheme -> "Detailed"];

We can use PlotRange[potential1] to get the x, y, and z ranges.

{xrange, yrange, zrange} = PlotRange[potential1];

contours = SliceContourPlot3D[x + y - x y, z == zrange[[1]], 
  {x, xrange[[1]], xrange[[2]]}, 
  {y, yrange[[1]], yrange[[2]]}, {z, zrange[[1]], zrange[[2]]}, 
  Contours -> 15,  PlotPoints -> 50, ColorFunction -> "TemperatureMap"];

Show[potential1, contours, 
  ImageSize -> 500, Lighting -> "Neutral", 
  PlotRange -> All, BoxRatios -> {1, 1, .6}, 
  FaceGrids -> {Back, Left}, ViewPoint -> {4, -4, 2}]

enter image description here

Update:

I need ContourPlot3D be transparent, Only curves appear

Use ContourShading -> None or ``ContourShading -> Opacity[0](and removeColorFunction-> "TemperatureMap") in SliceContourPlot3D` to get

enter image description here

If I changed range of x,y∈[0,1] does not give the desired result

This is what I get when I use {x, 0, 1} and {y, 0, 1} in both Plot3D and SliceContourPlot3D:

enter image description here

added 4 characters in body
Source Link
kglr
  • 400.5k
  • 18
  • 488
  • 929

In versions 10.2+, you can use SlicedContourPlot3D

potential1 = Plot3D[x + y - x y, {x, -5, 5}, {y, -5, 5}, 
 ClippingStyle -> None, Mesh -> None, ColorFunction -> (ColorData["Rainbow"][#3] &), 
 PlotStyle -> Directive[Opacity[0.9]], PlotTheme -> "Detailed"];

We can use PlotRange[potential1] to get the x, y, and z ranges.

zrange = PlotRange[potential1][[-1]];

contours = SliceContourPlot3D[x + y - x y, z == zrange[[1]], 
   {x, -5, 5}, {y, -5, 5}, {z, zrange[[1]], zrange[[2]]}, 
   Contours -> 15,  PlotPoints -> 50, ColorFunction -> "TemperatureMap"];

Show[potential1, contours, 
  ImageSize -> 500, Lighting -> "Neutral", 
  PlotRange -> All, BoxRatios -> {1, 1, .6}, 
  FaceGrids -> {Back, Left}, ViewPoint -> {4, -4, 2}]

enter image description here

Update:

I need ContourPlot3D be transparent, Only curves appear

Use ContourShading -> None (and remove ColorFunction-> "TemperatureMap") in SliceContourPlot3D to get

enter image description here

If I changed range of x,y∈[0,1] does not give the desired result

This is what I get when I use {x, 0, 1} and {y, 0, 1} in both Plot3D and SliceContourPlot3D:   

enter image description here

In versions 10.2+, you can use SlicedContourPlot3D

potential1 = Plot3D[x + y - x y, {x, -5, 5}, {y, -5, 5}, 
 ClippingStyle -> None, Mesh -> None, ColorFunction -> (ColorData["Rainbow"][#3] &), 
 PlotStyle -> Directive[Opacity[0.9]], PlotTheme -> "Detailed"];

We can use PlotRange[potential1] to get the x, y, and z ranges.

zrange = PlotRange[potential1][[-1]];

contours = SliceContourPlot3D[x + y - x y, z == zrange[[1]], 
   {x, -5, 5}, {y, -5, 5}, {z, zrange[[1]], zrange[[2]]}, 
   Contours -> 15,  PlotPoints -> 50, ColorFunction -> "TemperatureMap"];

Show[potential1, contours, 
  ImageSize -> 500, Lighting -> "Neutral", 
  PlotRange -> All, BoxRatios -> {1, 1, .6}, 
  FaceGrids -> {Back, Left}, ViewPoint -> {4, -4, 2}]

enter image description here

Update:

I need ContourPlot3D be transparent, Only curves appear

Use ContourShading -> None (and remove ColorFunction-> "TemperatureMap") in SliceContourPlot3D to get

enter image description here

If I changed range of x,y∈[0,1] does not give the desired result

This is what I get when I use {x, 0, 1} and {y, 0, 1} in both Plot3D and SliceContourPlot3D:  enter image description here

In versions 10.2+, you can use SlicedContourPlot3D

potential1 = Plot3D[x + y - x y, {x, -5, 5}, {y, -5, 5}, 
 ClippingStyle -> None, Mesh -> None, ColorFunction -> (ColorData["Rainbow"][#3] &), 
 PlotStyle -> Directive[Opacity[0.9]], PlotTheme -> "Detailed"];

We can use PlotRange[potential1] to get the x, y, and z ranges.

zrange = PlotRange[potential1][[-1]];

contours = SliceContourPlot3D[x + y - x y, z == zrange[[1]], 
   {x, -5, 5}, {y, -5, 5}, {z, zrange[[1]], zrange[[2]]}, 
   Contours -> 15,  PlotPoints -> 50, ColorFunction -> "TemperatureMap"];

Show[potential1, contours, 
  ImageSize -> 500, Lighting -> "Neutral", 
  PlotRange -> All, BoxRatios -> {1, 1, .6}, 
  FaceGrids -> {Back, Left}, ViewPoint -> {4, -4, 2}]

enter image description here

Update:

I need ContourPlot3D be transparent, Only curves appear

Use ContourShading -> None (and remove ColorFunction-> "TemperatureMap") in SliceContourPlot3D to get

enter image description here

If I changed range of x,y∈[0,1] does not give the desired result

This is what I get when I use {x, 0, 1} and {y, 0, 1} in both Plot3D and SliceContourPlot3D: 

enter image description here

added 534 characters in body
Source Link
kglr
  • 400.5k
  • 18
  • 488
  • 929
Loading
Source Link
kglr
  • 400.5k
  • 18
  • 488
  • 929
Loading