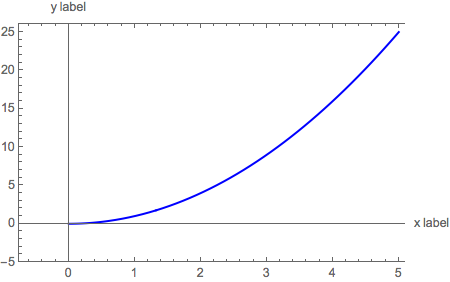
I want to plot a function ( I need the "Frame" and "ImagePadding" for later overlay of another graph):
Plot[t^2, {t, 0, 5}, PlotStyle -> Blue,
 Frame -> {True, True, True, False}, ImagePadding -> 25,
 AxesLabel -> {"x label", "y label"}]
but I cannot see the labels. I think that the labels are somewhere on the graph, but are not seen. Also I want to add a legend in order that later I can use Overlay, but I cannot get the hang of it. Do you have any tips?


PlotRangePadding -> Scaled[0.15]but the plot looks silly. $\endgroup$Plot[t^2, {t, 0, 5}, Frame -> True, FrameLabel -> (Style[#, Opacity[1]] & /@ {"x label", "y label"}), FrameStyle -> Opacity /@ {1, 0, 0, 1}]$\endgroup$