2
$\begingroup$

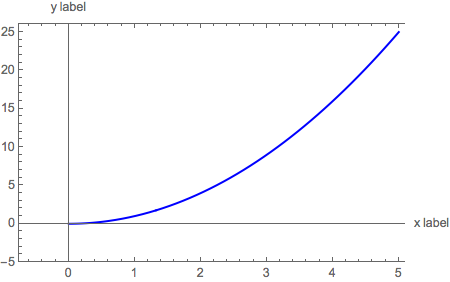
I want to plot a function ( I need the "Frame" and "ImagePadding" for later overlay of another graph):

Plot[t^2, {t, 0, 5}, PlotStyle -> Blue, Frame -> {True, True, True, False}, ImagePadding -> 25, AxesLabel -> {"x label", "y label"}]

but I cannot see the labels. I think that the labels are somewhere on the graph, but are not seen. Also I want to add a legend in order that later I can use Overlay, but I cannot get the hang of it. Do you have any tips?

$\endgroup$
7
  • $\begingroup$ Change "Axes" to "Frame" in AxesLabel. $\endgroup$
    – Artem
    Commented Feb 2, 2017 at 20:37
  • $\begingroup$ Thanks! This worked for this example, but what if I have "Frame -> {False, False, False, True}"? $\endgroup$ Commented Feb 2, 2017 at 20:48
  • $\begingroup$ Then you do not have axes to put the labels on. $\endgroup$
    – Artem
    Commented Feb 2, 2017 at 20:51
  • $\begingroup$ The axes aren't displayed if they are too near the frame. If you add lots of padding you will see them PlotRangePadding -> Scaled[0.15] but the plot looks silly. $\endgroup$ Commented Feb 2, 2017 at 20:55
  • $\begingroup$ You could use a full frame but make parts of it transparent? Plot[t^2, {t, 0, 5}, Frame -> True, FrameLabel -> (Style[#, Opacity[1]] & /@ {"x label", "y label"}), FrameStyle -> Opacity /@ {1, 0, 0, 1}] $\endgroup$ Commented Feb 2, 2017 at 21:01

1 Answer 1

2
$\begingroup$

When you use a frame, axes are suppressed, so you need to give Axes -> True. Also you must provide some extra space along the left side and bottom of the plot.

Plot[t^2, {t, 0, 5},
 PlotStyle -> Blue,
 Frame -> {{True, False}, {True, True}},,
 PlotRangePadding -> {{.75, Automatic}, {5, Automatic}},
 Axes -> True,
 AxesLabel -> {"x label", "y label"}]

plot

$\endgroup$

Your Answer

By clicking “Post Your Answer”, you agree to our terms of service and acknowledge you have read our privacy policy.

Not the answer you're looking for? Browse other questions tagged or ask your own question.