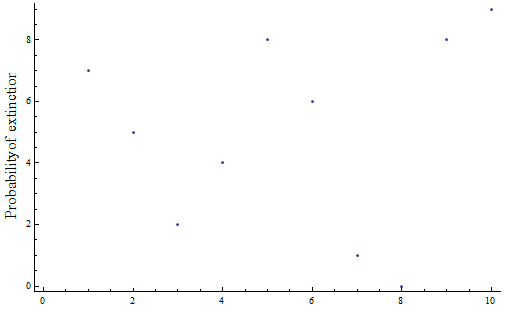
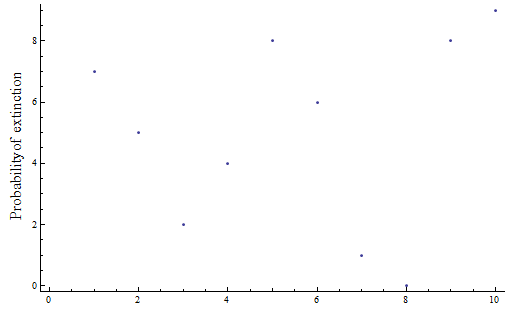
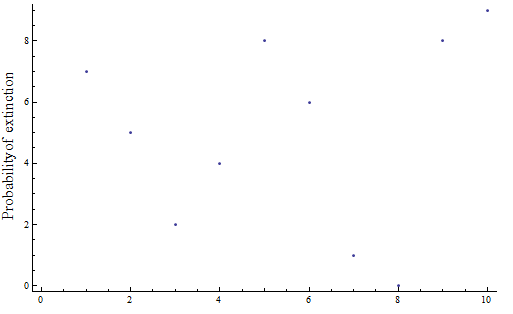
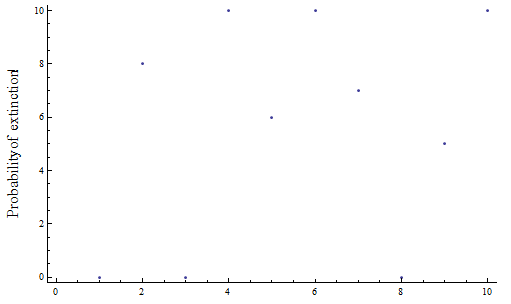
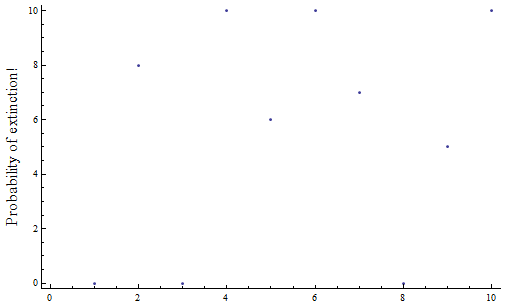
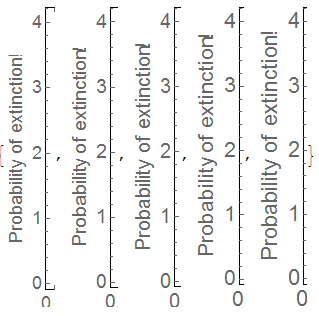
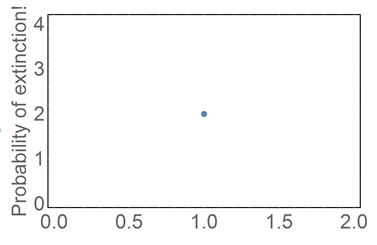
I am running into an issue whereby my Y frame label (I want to use this rather than an axis label to make the label vertical), is being cutoff when I view the graph.
See below for an indicative example. I would like the y axis label to be "Probability of extinction", but for some reason, the displayed graph has the 'n' of extinction cutoff.
ListPlot[Thread[{Range[4], Table[RandomReal[], {4}]}],
 Axes -> {True, True}, FrameLabel -> {"Probability of extinction"},
Frame -> {True, True, False, False}, BaseStyle -> {FontSize -> 16}]
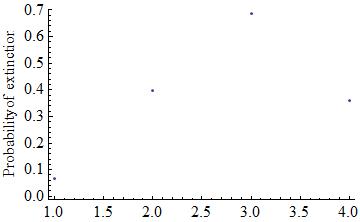
Can anyone advise on how to prevent this from happening? I have tried ImagePadding and ImageMargins, but neither seem to help.
Best,
Ben

