4
$\begingroup$

If I want to label the $x$-axis of a ListLinePlot , how do I do that?

There are two types of label:

  • a units label which would go to the right of the axis,

and then potentially you could have an

  • axis label below it.

What would be the way to enter both types of text?

$\endgroup$
1
  • $\begingroup$ ListLinePlot[RandomReal[1, 6], AxesLabel -> {"meter\ndistance", "y"}] ? $\endgroup$
    – Szabolcs
    Commented Jan 16, 2014 at 17:09

3 Answers 3

8
$\begingroup$

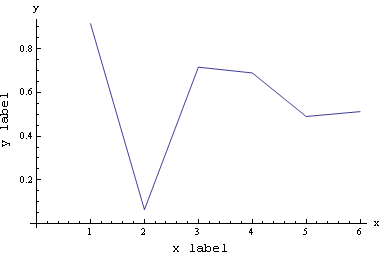
Labeled is quite short solution:

Labeled[ListLinePlot[RandomReal[1, 6], AxesLabel -> {"x", "y"}], 
        {"x label", "y label"}, 
        {Bottom, Left}, RotateLabel -> True]

enter image description here

$\endgroup$
1
$\begingroup$

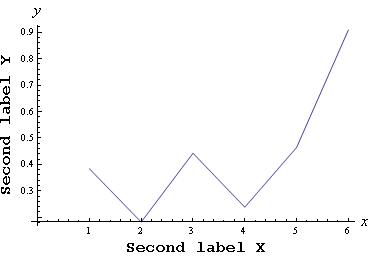
Try this:

   Row[{
  Rotate[Style["Second label Y", 16, Bold], 90 Degree],
  Spacer[10],
  Column[{
    ListLinePlot[RandomReal[1, 6], 
     AxesLabel -> {Style["x", 16, Italic], Style["y", 16, Italic]}, 
     ImageSize -> 350],
    Style["Second label X", 16, Bold]
    }, Alignment -> Center]
  }]

You should obtain something of this sort: enter image description here

$\endgroup$
1
$\begingroup$

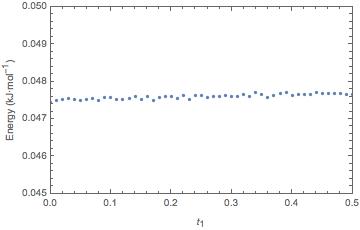
It's probably late to mention, but I always add frame in my plot

`ListPlot[t1b9, PlotRange -> {{0, 0.5}, {0.045, 0.05}}, Frame -> True, FrameLabel -> {"t_1","Energy (kJ/mol)"}]`

which produces the following graph, t1b9 is just the data collection I used for my plot

enter image description here

Hope this helps!

$\endgroup$
1
  • $\begingroup$ For clarity, please provide the complete code and resulting plot with two labels per axis, as the other two answers do. $\endgroup$
    – bbgodfrey
    Commented Jan 4, 2017 at 5:20

Your Answer

By clicking “Post Your Answer”, you agree to our terms of service and acknowledge you have read our privacy policy.

Not the answer you're looking for? Browse other questions tagged or ask your own question.