Through code:
f[x_, y_, z_] = x^2 + y^2 - z^2;

RegionPlot3D[
 x^2 + y^2 - z^2 <= 1 && 0 <= z <= 1,
 {x, -2, 2}, {y, -2, 2}, {z, 0, 1},
 Axes -> True,
 AxesLabel -> {x, y, z},
 ColorFunction -> Function[{x, y, z},
   ColorData["Rainbow"][f[x, y, z]]],
 ColorFunctionScaling -> False,
 MeshFunctions -> Function[{x, y, z}, f[x, y, z]],
 BoxRatios -> {1, 1, 1},
 PlotPoints -> 75,
 PlotLegends -> BarLegend["Rainbow"]]
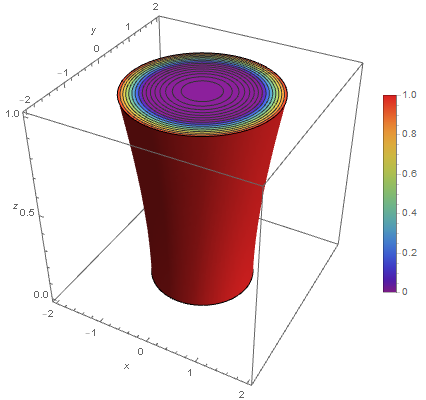
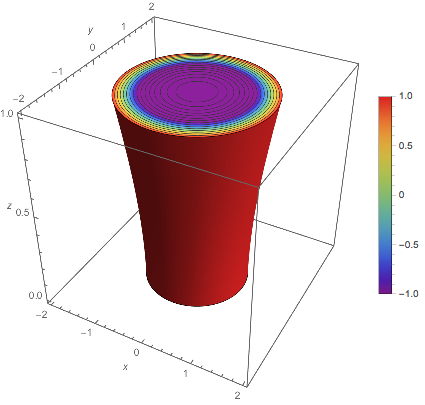
I get:
but even if the maximum value is properly 1 for x^2+y^2-z^2=1, the minimum value should be -1 for (0, 0, 1), not 0! What am I doing wrong?
In addition, through the code (which I think is more elegant):
f[x_, y_, z_] = x^2 + y^2 - z^2;

A = ImplicitRegion[x^2 + y^2 - z^2 <= 1 && 0 <= z <= 1, {x, y, z}];

RegionPlot3D[
 A,
 Axes -> True,
 AxesLabel -> {x, y, z},
 ColorFunction -> Function[{x, y, z},
   ColorData["Rainbow"][f[x, y, z]]],
 ColorFunctionScaling -> False,
 MeshFunctions -> Function[{x, y, z}, f[x, y, z]],
 BoxRatios -> {1, 1, 1},
 PlotPoints -> 75,
 PlotLegends -> BarLegend["Rainbow"]]
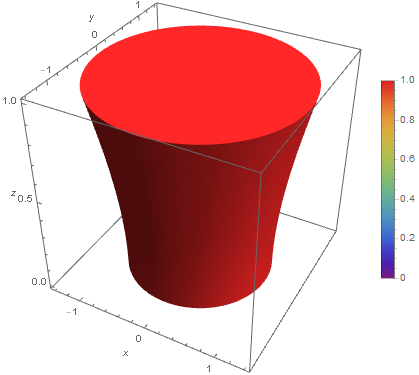
I get:
and here I really do not understand anything! Why this mess?
Somebody, please, could enlighten me? Thank you!

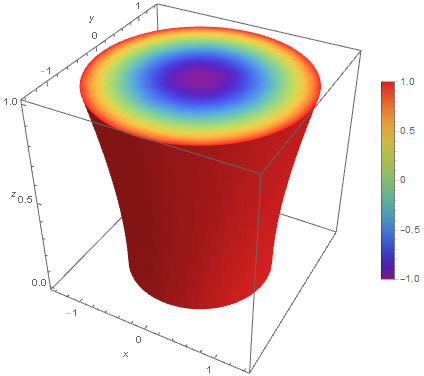

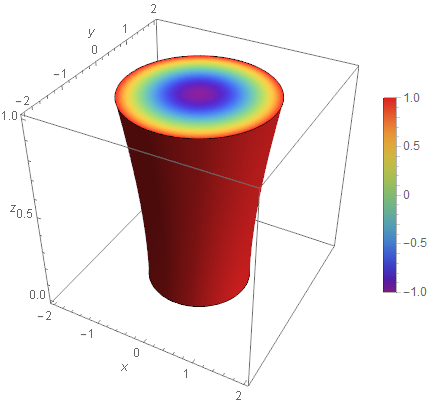
ImplicitRegioncase but I don't understand it. Hopefully someone else does and answers that soon. If not I'll look again later. $\endgroup$RegionPlot*[region]is not well documented and does not really behave likeRegionPlot*[inequalities]. Right now, it seems to be an interface toDiscretizeRegionandMeshRegionstyling. I don't know what WRI's intentions are, and whether they plan to implement such things asMeshand other styling options. (I'm assuming that since it's still undocumented, they're working on it. They seem to acknowledge that there is still work to be done on regions, but I don't know how much of a priority plotting is. Manu, you might report it; requests from clients can affect priorities.) $\endgroup$