BarLegend["Rainbow"] gives a generic bar over a range of [0, 1].
BarLegend["Rainbow"]
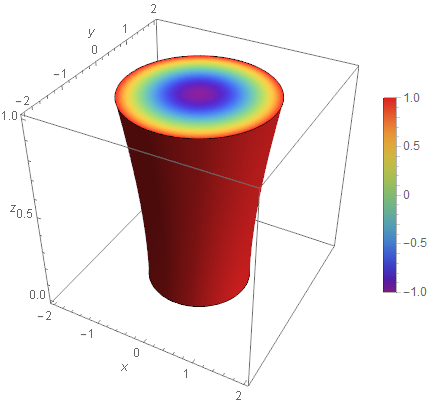
It appears that for RegionPlot3D you will need to specify the range manually:.
Update: adjusted to match your target plot from your own solution.
f[x_, y_, z_] := x^2 + y^2 - z^2;

RegionPlot3D[x^2color += y^2ColorData[{"Rainbow", {-1, z^21}}];

RegionPlot3D[f[x, y, z] <= 1 && 0 <= z <= 1, {x, -2, 2}, {y, -2, 2}, {z, 0, 1},

 Axes -> True, AxesLabel -> {x, y, z},
 ColorFunction -> Function[{x,(color y,@ z}f[#, ColorData["Rainbow"][f[x#2, y,#3] z]]]&),
 ColorFunctionScaling -> False, MeshFunctionsMesh -> Function[{x, y, z}, f[x, y, z]]False,
 BoxRatios -> {1, 1, 1}, PlotPoints -> 75,
 PlotLegends -> BarLegend[{"Rainbow"color, {-1, 1}}]]


