3
$\begingroup$

I'm trying to make motion plot interference of two waves i used

lines to represent amplitude and wave envelope separately.

This works for the traveling waves, but no the interfering wave.

i'm struggling with last part how to plot the interference.

code is commented and easily readable the problem with last part interfering part

w1[x_, t_] := {x, 7 + Sin[2*Pi*(x - t)]}; 

w2[x_, t_] := {x, 4 + Sin[2*Pi*(x + t)]}; 

wr[x_, t_] := {x, w1[x, t] + w2[x, t]};


"right travel table"

lw1[t_] := Line[{w1[x, t], {x, 7}}]; 
gw1[t_] := Graphics[{Thick,Red, lw1[t]}, AspectRatio -> 0.75, Axes -> True, 
    AxesOrigin -> {0, 0}, Ticks -> None]; 
tw1[t_] := Table[gw1[t], {x, 0, 2*Pi, 0.05}]; 
pw1[t_] := ParametricPlot[{w1[x, t]}, {x, 0, 2*Pi}, PlotStyle -> Red]; 


"left travel table"

lw2[t_] := Line[{w2[x, t], {x, 4}}]; 
gw2[t_] := Graphics[{Thick,Blue, lw2[t]}, AspectRatio -> 0.75, Axes -> True, 
    AxesOrigin -> {0, 0}, Ticks -> None]; 
tw2[t_] := Table[gw2[t], {x, 0, 2*Pi, 0.05}]; 
pw2[t_] := ParametricPlot[{w2[x, t]}, {x, 0, 2*Pi}, PlotStyle -> Blue];


"Interfering Waves"
" What Mistake i made here i struggled hard with it all way around"

lw3[t_] := Line[{{wr[x, t]}, {x}}]
gw3[t_] := Graphics[{Black, lw3[t]}]
tw3[t_] := Table[gw3[t], {x, -Pi, Pi, 0.05}]; 
pw3[t_] := ParametricPlot[{wr[x, t]}, {x, -Pi, Pi}, PlotStyle -> Black];


 "Table to generate motion pic "

td1[t_] := Table[Show[{tw1[t], tw2[t], pw1[t], pw2[t]}, Axes -> True, Frame -> True, 
     ImageSize -> {600, 400}], {t, 0, 1 - 0.02, 0.02}]; 


 " to export motion pic same place notebook saved" 

SetDirectory[NotebookDirectory[]]; 
Export["Inteferance.gif", {td1[t]}]; 

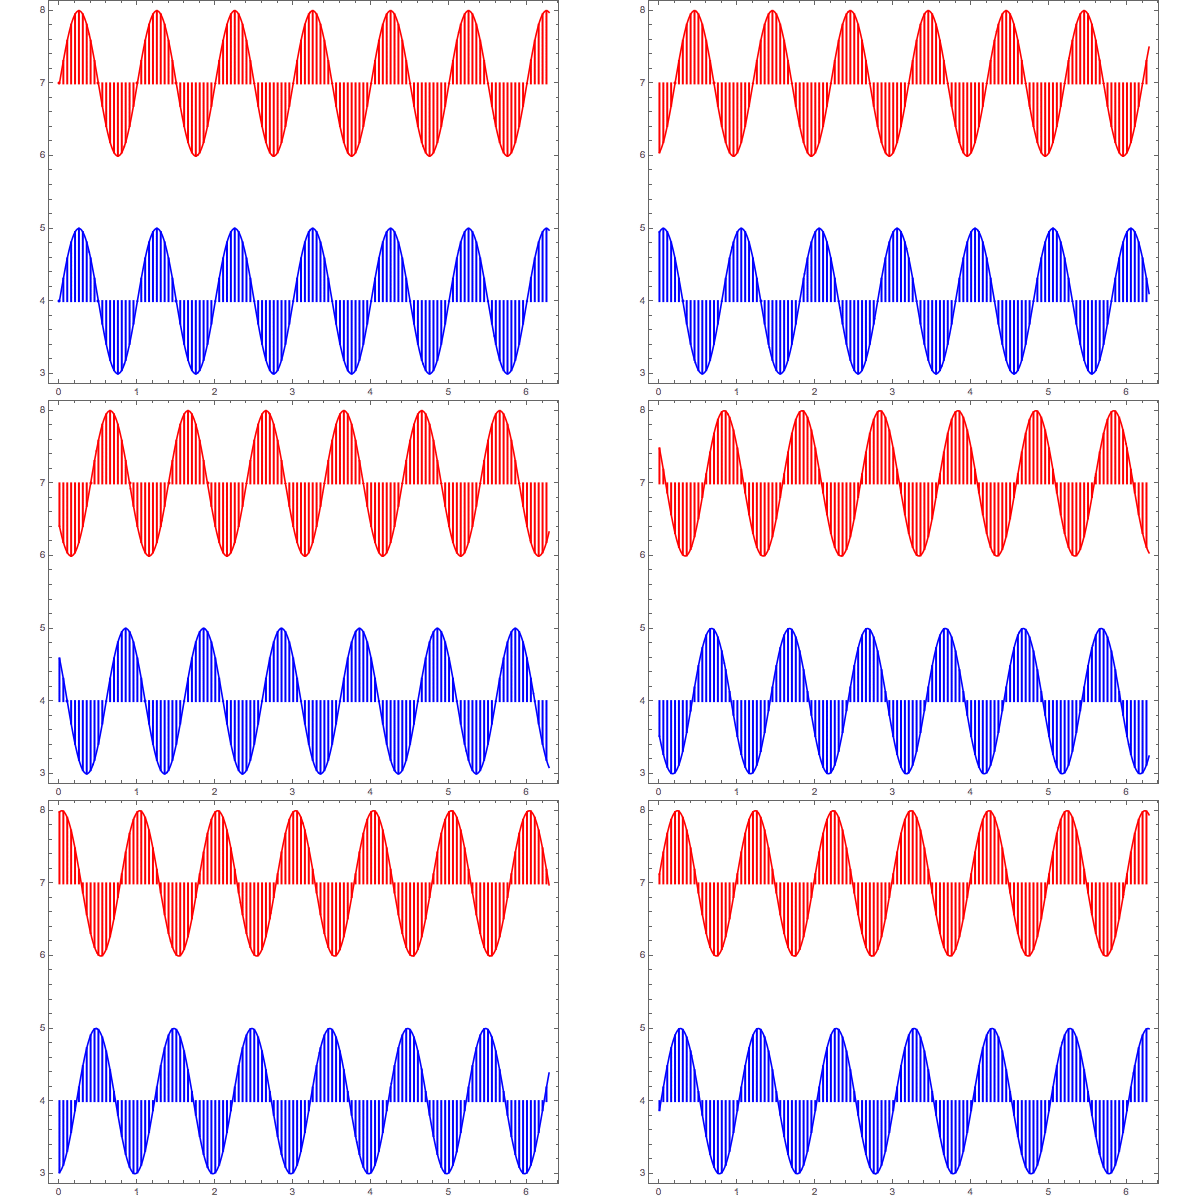
The plot for the two waves without interfering wave

enter image description here

$\endgroup$
2
  • 1
    $\begingroup$ Re the "weird line", Change Plot to ParametricPlot or remove x from definitions of w1, w2, and wr; that is, use w1[x_, t_] := 6 + Sin[2*Pi*(x - t)] etc. $\endgroup$
    – kglr
    Commented Mar 21, 2019 at 22:08
  • $\begingroup$ thanks cool it works $\endgroup$
    – Alrubaie
    Commented Mar 21, 2019 at 22:27

1 Answer 1

5
$\begingroup$

I copied your code and fixed a few problems, noted with comments:

w1[x_, t_] := {x, 7 + Sin[2*Pi*(x - t)]};
w2[x_, t_] := {x, 4 + Sin[2*Pi*(x + t)]};
(* changed wr to take second part of w1 and w2 for the sum *)
wr[x_, t_] := {x, w1[x, t][[2]] + w2[x, t][[2]]};

lw1[t_] := Line[{w1[x, t], {x, 7}}];
gw1[t_] := Graphics[{Thick, Red, lw1[t]}, AspectRatio -> 0.75, Axes -> True, AxesOrigin -> {0, 0}, Ticks -> None];
tw1[t_] := Table[gw1[t], {x, 0, 2*Pi, 0.05}];
pw1[t_] := ParametricPlot[{w1[x, t]}, {x, 0, 2*Pi}, PlotStyle -> Red];

lw2[t_] := Line[{w2[x, t], {x, 4}}];
gw2[t_] := Graphics[{Thick, Blue, lw2[t]}, AspectRatio -> 0.75, Axes -> True, AxesOrigin -> {0, 0}, Ticks -> None];
tw2[t_] := Table[gw2[t], {x, 0, 2*Pi, 0.05}];
pw2[t_] := ParametricPlot[{w2[x, t]}, {x, 0, 2*Pi}, PlotStyle -> Blue];

(* removed extra curly brackets around first point in Line *) 
(* added y-coord (7+4=11) to second point in Line *)
lw3[t_] := Line[{wr[x, t], {x, 11}}] 
gw3[t_] := Graphics[{Black, lw3[t]}]
(* changed the x-ranges to match the other waves *)
tw3[t_] := Table[gw3[t], {x, 0, 2 Pi, 0.05}];
pw3[t_] := ParametricPlot[{wr[x, t]}, {x, 0, 2 Pi}, PlotStyle -> Black];

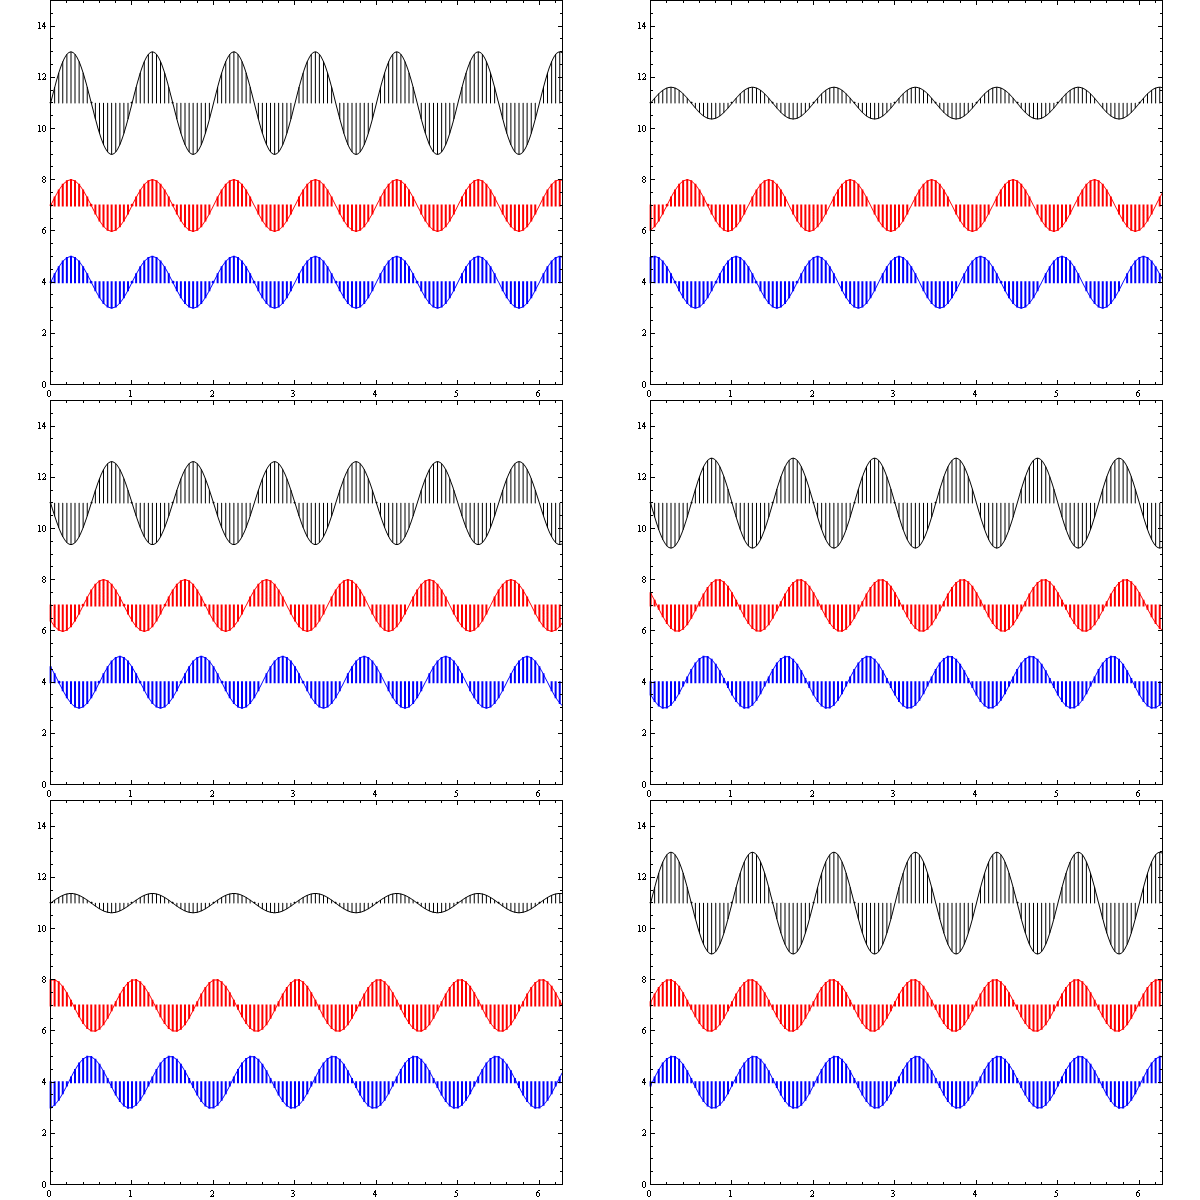
exp = Table[Show[{tw1[t], tw2[t], tw3[t], pw1[t], pw2[t], pw3[t]}, Axes -> True, Frame -> True, ImageSize -> {600, 400}, PlotRange -> {{0, 2 Pi}, {0, 15}}], {t, 0, 1 - 0.02, 0.02}];

enter image description here

$\endgroup$

Your Answer

By clicking “Post Your Answer”, you agree to our terms of service and acknowledge you have read our privacy policy.

Not the answer you're looking for? Browse other questions tagged or ask your own question.