7
$\begingroup$

Bug introduced in 10.4.0 and fixed in 11.0.0


I am using Mathematica 10.4

In the documantion page of ImplicitRegion, there is an example

R = ImplicitRegion[x^2 + y^2 == 1, {x, y}];
RegionPlot[R]

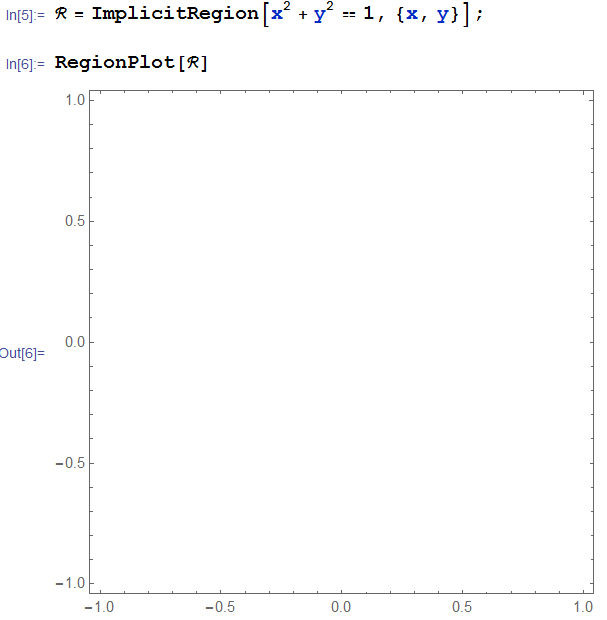
This should give a perfect circle. However, I got nothing after I run it.

enter image description here

What is wrong?

$\endgroup$
10
  • $\begingroup$ Sometimes it will work, but in the docs it says it can only find regions of "positive measure", so not lines or points $\endgroup$
    – Jason B.
    Commented Apr 20, 2016 at 15:25
  • $\begingroup$ But for some special cases it seems to work, i.e. RegionPlot @ Circle[] $\endgroup$
    – Jason B.
    Commented Apr 20, 2016 at 15:26
  • $\begingroup$ @JasonB Hi, Jason B. I don't understand. They put a perfect circle in doc page of ImplicitRegion, why it is not working? $\endgroup$
    – matheorem
    Commented Apr 20, 2016 at 15:33
  • $\begingroup$ You are correct there, the example on that documentation page clearly does not work. But the doc page for RegionPlot says it shouldn't, something fishy going on.... $\endgroup$
    – Jason B.
    Commented Apr 20, 2016 at 15:38
  • 2
    $\begingroup$ @matheorem Notice that the documentation is contradictory on this point. The "Possible Issues" section of the RegionPlot docs specifically says that "RegionPlot will only visualize two-dimensional regions", with the very example of the failure with $x^2+y^2=1$. On the other hand, the ImplicitRegion docs specifically show that what you did should work, but then it actually doesn't in MMA 10.4. This seems a documentation bug, rather than an implementation error. $\endgroup$
    – MarcoB
    Commented Apr 20, 2016 at 16:26

3 Answers 3

7
$\begingroup$

I reported this to WRI tech support. This is what I sent them

I have encountered an issue when evaluating an example given in ref/ImplicitRegion. The example before I evaluated its code showed a circle. Evaluation should have redrawn the circle, but it actually produced a blank plot. I enclose a screen capture to illustrate the problem.

screen capture omitted

I believe this example worked in releases prior to 10.4. I would guess the documentation was carried over from an earlier release without having been validated for 10.4. It appears that either recent changes have broken RegionPlot or the documentation was not edited to reflect those recent changes.

This was the answer I received:

I have filed a report with our developers on this issue with the ImplicitRegion documentation. This may allow them to fix the problem in a future version of Mathematica.

Ambiguous isn't it? There is an admission that something needs to be fixed, but nothing that declares the issue to be either a Mathematica code bug or a Documentation Center bug. Perhaps the tech support person didn't know and is leaving it to the determination to the developers. All I really got from tech support was that something is wrong and it might be fixed someday.

Weak as it is, I think it enough to tag the question with .

$\endgroup$
2
  • $\begingroup$ Thank you so much, m_goldberg. I agree that the reply you received is ambiguous enough : ) Another thing I don't understand is why my post got so many close votes? $\endgroup$
    – matheorem
    Commented Apr 27, 2016 at 2:30
  • 1
    $\begingroup$ @matheorem. I don't understand it either. I see no reason to close your question. In my opinion a question that had been up-voted and has up-voted answers should only be closed for some very major fault that is stated in a comment. $\endgroup$
    – m_goldberg
    Commented Apr 27, 2016 at 12:32
5
$\begingroup$

No, it doesn't. But this workaround helps:

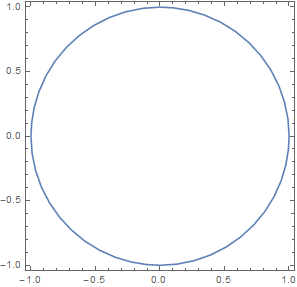
reg = ImplicitRegion[x^2 + y^2 <= 1, {x, y}]
RegionPlot[reg, BoundaryStyle -> Darker, PlotStyle -> White]

enter image description here

$\endgroup$
1
$\begingroup$

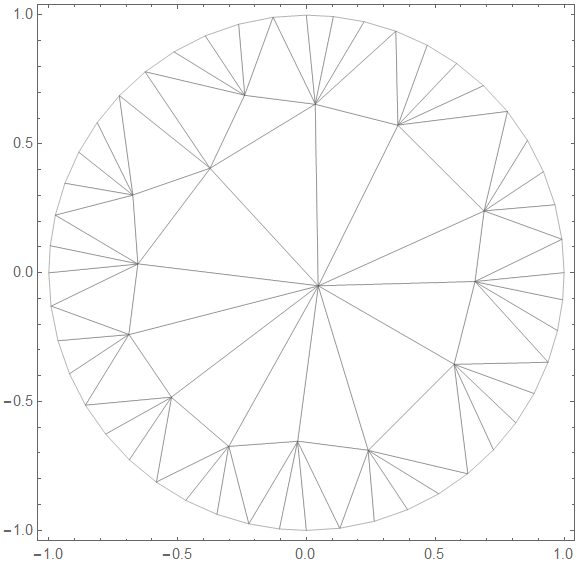
rewi gives a workaround. But I notice the curve generated by RegionPlot is actually jiggling instead of smooth, this can be confirmed if we turned on Mesh->All

reg = ImplicitRegion[x^2 + y^2 <= 1, {x, y}];
RegionPlot[reg, BoundaryStyle -> Darker, PlotStyle -> White, 
 Mesh -> All]

enter image description here

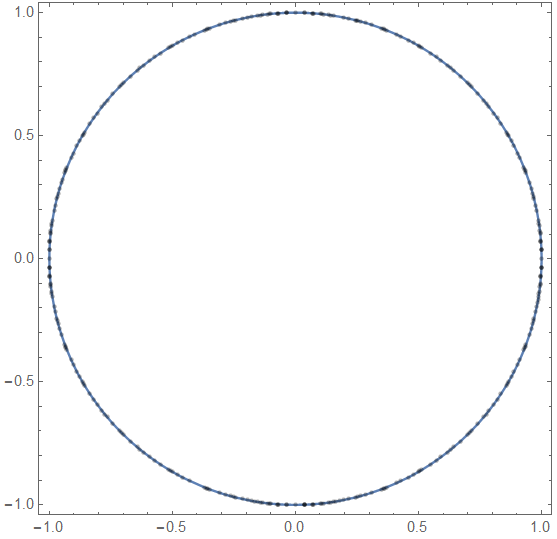
On the other hand, ContourPlot is designed for this kind of task

ContourPlot[x^2 + y^2 == 1, {x, -1, 1}, {y, -1, 1}, Mesh -> All]

enter image description here

$\endgroup$

Your Answer

By clicking “Post Your Answer”, you agree to our terms of service and acknowledge you have read our privacy policy.

Not the answer you're looking for? Browse other questions tagged or ask your own question.