4
$\begingroup$

Using Mathematica 11.0.1.0 on a MacBook Pro (OSX 10.11.6) I tried this:

Clear[x, y, reg1]
reg1 = ImplicitRegion[
   Log[10, 1 + x^2 + y^2] <= 1 + Log[10, x + y], {x, y}];
RegionPlot[reg1]

But got only this output:

RegionPlot[reg1]

But I did get the area.

Area[reg1]

Which gave the correct answer $49\pi$. Then I tried:

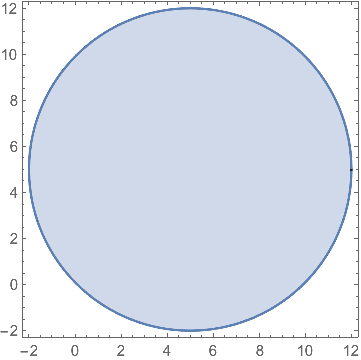
RegionPlot[
 Log[10, 1 + x^2 + y^2] <= 1 + Log[10, x + y], {x, -2, 12}, {y, -2, 
  12}]

And I did get the correct image:

enter image description here

Is the fact that RegionPlot[reg1] did not work a bug that should be reported, or have I made some sort of mistake?

$\endgroup$
1
  • 4
    $\begingroup$ RegionPlot[region] and RegionPlot[inequality, vars...] are not equivalent. For instance, try DiscretizeRegion[reg1] and DiscretizeRegion[reg1, Method -> "RegionPlot"]. I think your (failed) RegionPlot uses the first approach. $\endgroup$
    – Michael E2
    Commented Dec 3, 2016 at 22:00

1 Answer 1

1
$\begingroup$

THIS IS JUST AN EXTENDED COMMENT

The region definition can be simplified to

reg2 = ImplicitRegion[
   1 + x^2 + y^2 <= 10 (x + y),
   {x, y}];

Area[reg2]

(*  49 π  *)

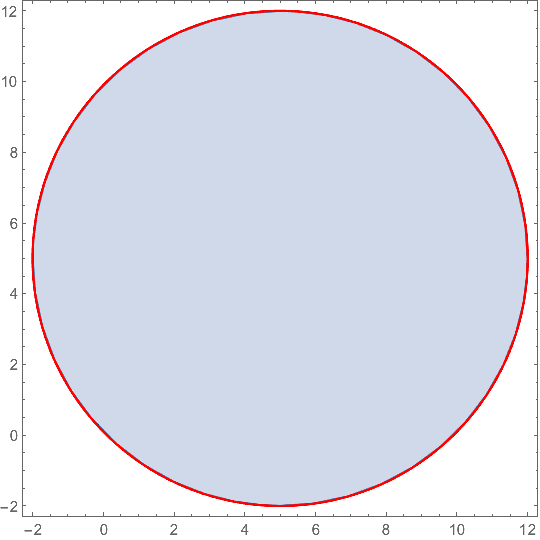
Show[
 RegionPlot[reg2],
 ContourPlot[
  Log10[1 + x^2 + y^2] == 1 + Log10[x + y],
  {x, -2, 12}, {y, -2, 12},
  ContourStyle -> Red,
  PlotPoints -> 50]]

enter image description here

$\endgroup$

Your Answer

By clicking “Post Your Answer”, you agree to our terms of service and acknowledge you have read our privacy policy.

Not the answer you're looking for? Browse other questions tagged or ask your own question.