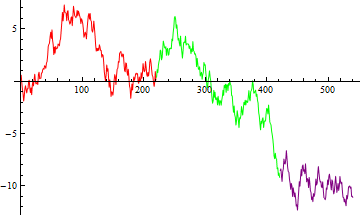
lst1 = Accumulate[RandomReal[{-1, 1}, 540]];
1. Restructure your input data:
lst2 = MapIndexed[{#2[[1]], #} &, lst1];

{data1, data2, data3} = {lst2[[;; 220]], lst2[[221 ;; 421]], lst2[[422 ;;]]};

ListLinePlot[{data1, data2, data3} ]
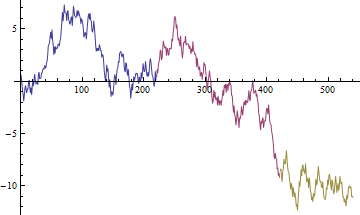
2. Use Mesh and MeshShading:
ListLinePlot[lst1, Mesh -> {{221, 422}}, MeshShading -> {Red, Blue, Green}]
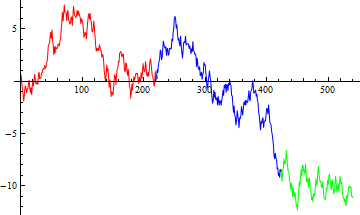
3. Use ColorFunction that specifies different colors for different values of x:
ListLinePlot[lst1, ColorFunctionScaling -> False,
 ColorFunction->Function[{x, y}, Which[x <= 220, Orange, 221 <= x < 421, Cyan, True, Red]]]
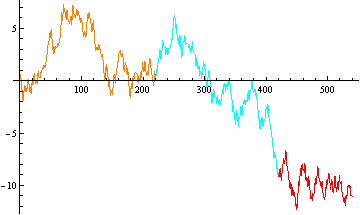
4. Plot each piece separately with appropriate DataRange values and combine with Show:
ranges = {{1, 220}, {221, 421}, {422, 540}};
colors = {Red,  Green, Purple};

plots = ListLinePlot[lst1[[Span @@ #]],  DataRange -> #,
     PlotStyle -> #2] & @@@ Transpose[{ranges, colors}];
Show[plots, PlotRange -> All]
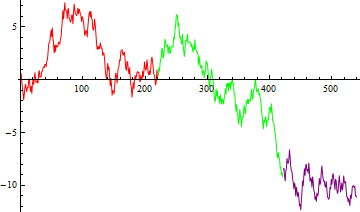
5. Post-process ListLinePlot output to add different directives for different pieces:
ListLinePlot[lst1] /.
 Line[x_] :> ({#, Line[x[[Span @@ #2]]]} & @@@ Transpose[{colors, ranges}])
