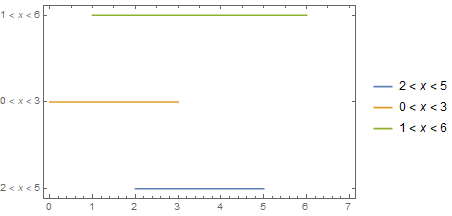
Suppose the following line segments:
2<x<5
0<x<3
1<x<6
I would like to somehow see a plot of those line segments. Preferably vertically, stacked in the order of occurrence in the original list.
Prefer to use Mathematica.
I tried:
Plot[2 < x < 5, {x, 0, 7}]
...and am not even able to see the line segment requested.
If I could at least see the line segment (perhaps thick and colored?), I could go another round subsequently for each additional line segment, three different plots, and view and compare the relative lengths of the line segments stacked one upon the other. Then perhaps send all to a .pdf file for later viewing.
One single plot would be the ideal. Using the above approach the line segments would overlap each other. Which would be useless. I would have to create three different plots, one after the next.
Any suggestions appreciated.
Nicholas Kormanik


NumberLinePlot$\endgroup$