2
$\begingroup$

I have a data list in the following form,

data = {x, y, z, f}

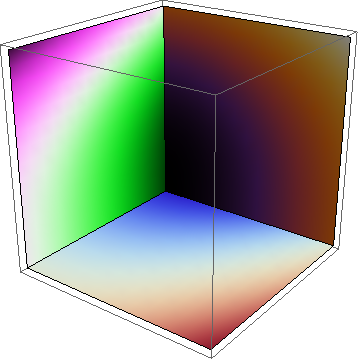
I would like to present three kinds of subdata set as a density (or contour) plot on the respective planes at once in one 3D graph.

  1. data1 = {x, y, f}

  2. data2 = {y, z, f}

  3. data3 = {x, z, f}

How could I make an above kind of plot?

I really appreciate if anyone help me.

$\endgroup$
0

2 Answers 2

4
$\begingroup$

For example:

f[x_, y_, z_] := x + y y + z z z
data = Flatten[Table[{{x, y, z}, f[x, y, z]}, {x, 0, 1, .1}, {y, 0, 1, .1}, {z, 0, 1, .1}], 2];
fi = Interpolation@data;
dpx = Rasterize@ DensityPlot[fi[0, y, z], {y, 0, 1}, {z, 0, 1}, Frame -> False, 
    ColorFunction -> "SunsetColors", PlotRangePadding -> 0];
dpy = Rasterize@ DensityPlot[fi[x, 0, z], {x, 0, 1}, {z, 0, 1}, Frame -> False, 
    ColorFunction -> "GreenPinkTones", PlotRangePadding -> 0];
dpz = Rasterize@ DensityPlot[fi[x, y, 0], {x, 0, 1}, {y, 0, 1}, Frame -> False, 
    ColorFunction -> "ThermometerColors", PlotRangePadding -> 0];
Graphics3D[{
  {Texture@dpx, Polygon[{{0, 0, 0}, {0, 1, 0}, {0, 1, 1}, {0, 0, 1}}, 
    VertexTextureCoordinates -> {{0, 0}, {1, 0}, {1, 1}, {0, 1}}]},
  {Texture@dpy, Polygon[{{0, 0, 0}, {1, 0, 0}, {1, 0, 1}, {0, 0, 1}}, 
    VertexTextureCoordinates -> {{0, 0}, {1, 0}, {1, 1}, {0, 1}}]}, 
  {Texture@dpz, 
   Polygon[{{0, 0, 0}, {1, 0, 0}, {1, 1, 0}, {0, 1, 0}}, 
    VertexTextureCoordinates -> {{0, 0}, {1, 0}, {1, 1}, {0, 1}}]}}, 
 Lighting -> "Neutral"]
Mathematica graphics

$\endgroup$
1
  • $\begingroup$ Many thanks. It helped. $\endgroup$
    – Veteran
    Commented Oct 28, 2013 at 14:19
2
$\begingroup$

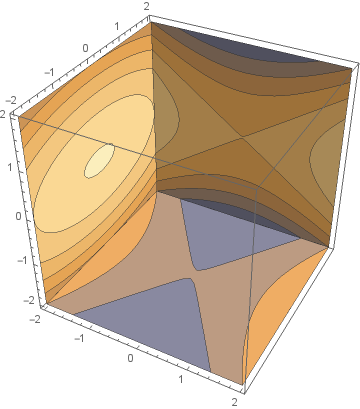
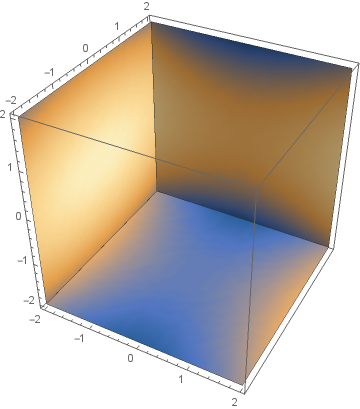
In versions 10.2+, you can use SliceContourPlot3D or SliceDensityPlot3D with "BackPlanes" as the second argument:

f[x_, y_, z_] := x^2 - .5 y^2 - 2z^2

SliceContourPlot3D[f[x,y,z],"BackPlanes",{x,-2,2},{y,-2,2},{z,-2,2}]

enter image description here

SliceDensityPlot3D[f[x,y,z],"BackPlanes",{x,-2,2},{y,-2,2},{z,-2,2}]

enter image description here

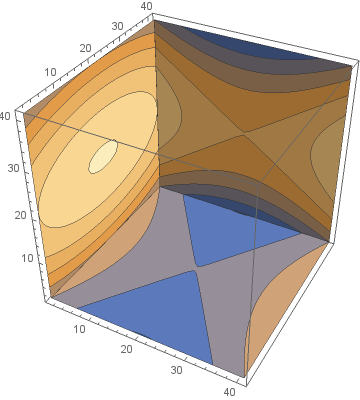
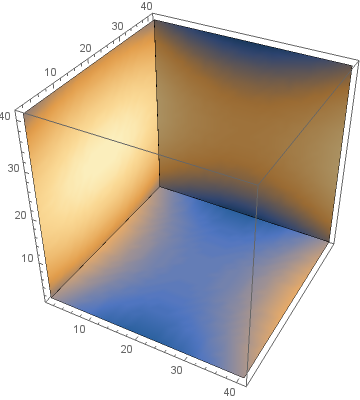
data =Table[ f[x,y,z], {z, -2,2, 0.1}, {y,-2, 2, 0.1}, {x,-2, 2, 0.1}];
ListSliceContourPlot3D[data, "BackPlanes"]

enter image description here

ListSliceDensityPlot3D[data, "BackPlanes"]

enter image description here

The data can also be a list of {x, y, z, f[z,y,z]} 4-tuples. For

data0 = Flatten[Table[ {x,y,z,f[x,y,z]}, {z, -2,2, 0.1}, 
  {y,-2, 2, 0.1}, {x,-2, 2, 0.1}], 2];

ListSliceContourPlot3D[data0, "BackPlanes"] and ListSliceDensityPlot3D[data0, "BackPlanes"]give the same results as above.

$\endgroup$

Your Answer

By clicking “Post Your Answer”, you agree to our terms of service and acknowledge you have read our privacy policy.

Not the answer you're looking for? Browse other questions tagged or ask your own question.