1
$\begingroup$

I hobbled together a For loop to create a series ListLinePlots and appended them to a list to display them with the Show function.

My problem is I have no control over the images viewable domain and range because I can't seem to modify the viewing range and domain of a ListLinePlot image.

I tried the PlotRange-> options(All, Full and Automatic) but Show only takes into account the viewing range and domain of the first image so I can't see that being a fix.

My current idea is to create a plot with the viewable domain and range I want and have it as the first element in the list I use Show on but I can't seem to think how to make an empty(ish) plot that allows me modify the range and domain to the values I need. Does any one have any suggestions of an non-intrusive graph to plot that would work?

Thank you in advanced for any help, Bright
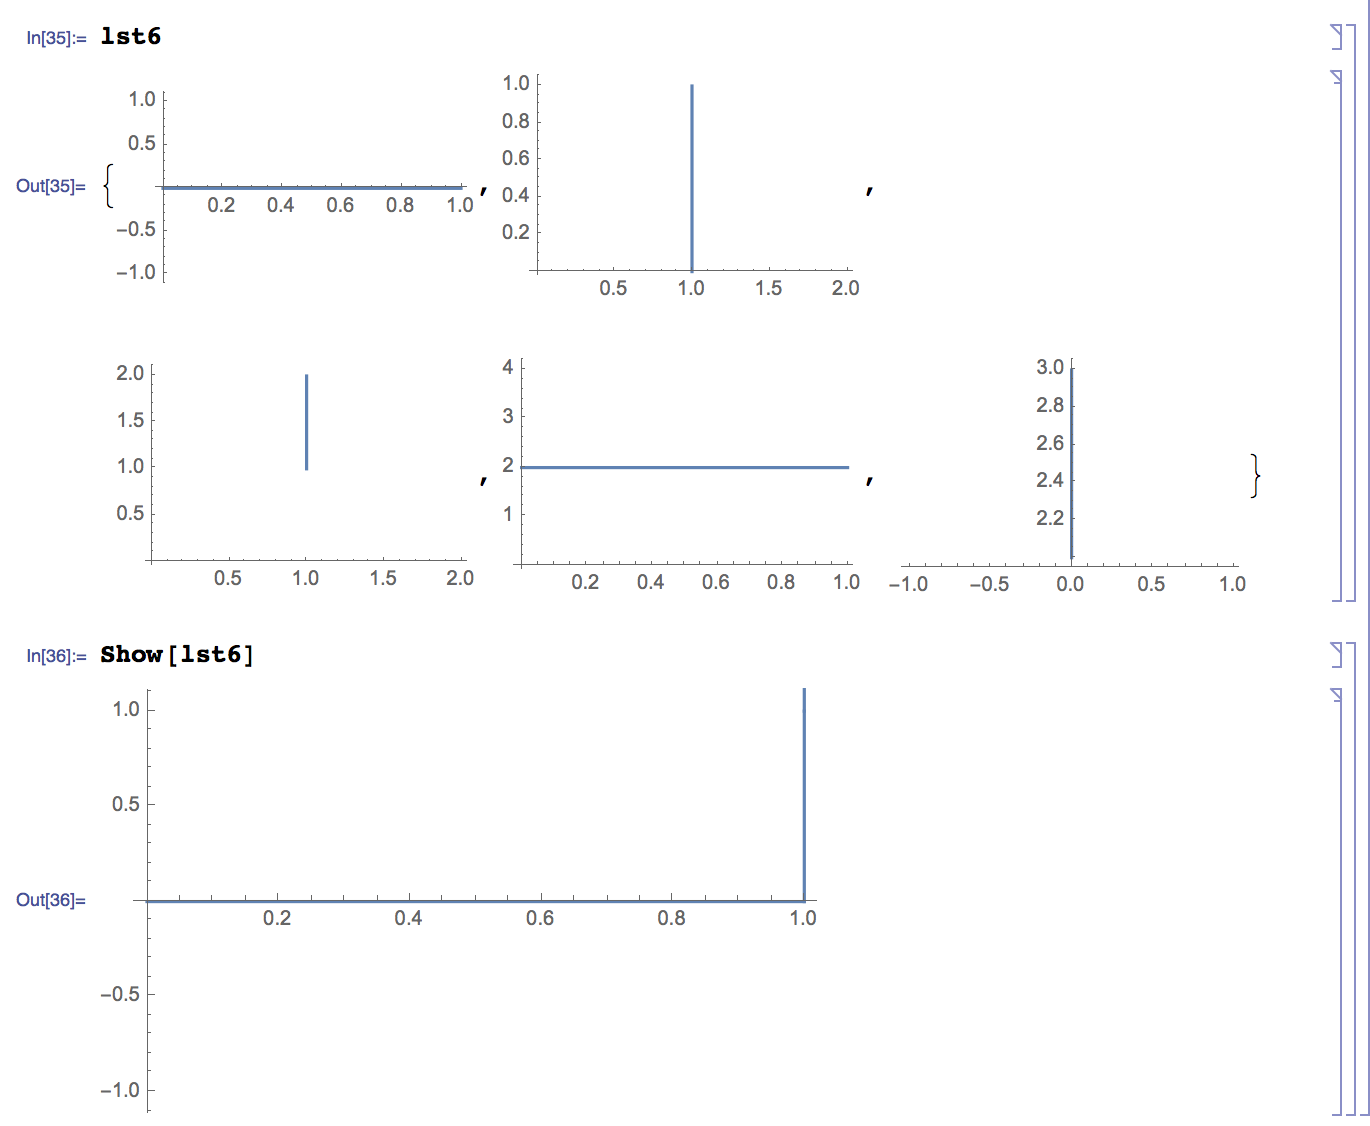
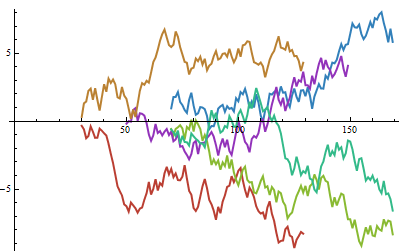
The List of Images and Current Show Output

$\endgroup$
3
  • $\begingroup$ Hi, welcome to mathematica.SE :) Could you provide a minimal example of plots? $\endgroup$
    – Kuba
    Commented Dec 4, 2014 at 8:06
  • $\begingroup$ All the line plots with the ListLinePlots function have a magnitude of 1. They are all in each one of four directions: Up, Down, Left, Right. This sadly makes the result of the Show function a 1 by 1 image centered at the point (0.5, 0.5) even when some ListLinePlots are graphed outside of that 1 by 1 viewing window. I'll get some images posted in 9 to 10 hours(no internet connect on the computer in question at the moment). $\endgroup$
    – BrightHalo
    Commented Dec 4, 2014 at 8:36
  • $\begingroup$ The Show function only uses the viewing range and domain of the first ListLinePlot in the list and what the first ListLinePlot considers to be All is only part of the overall picture when you look at all the ListLinePlots overlaid on one another. $\endgroup$
    – BrightHalo
    Commented Dec 4, 2014 at 17:05

1 Answer 1

3
$\begingroup$
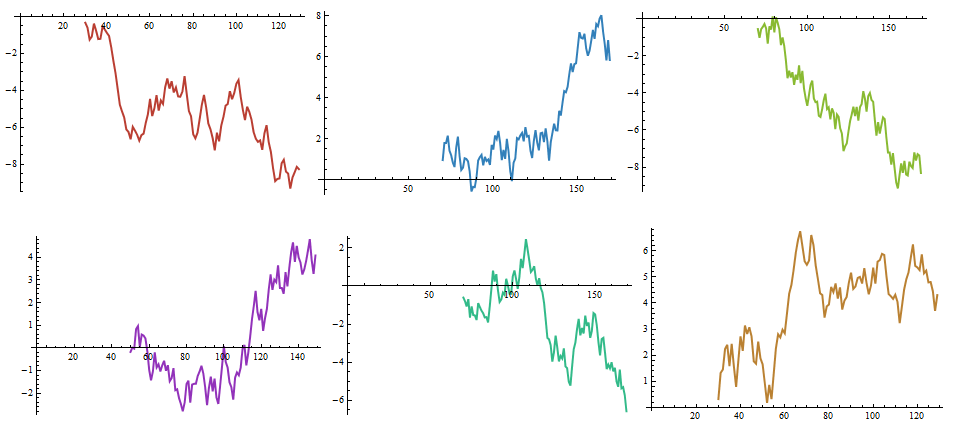
dt = Table[Transpose[{Range[ri = RandomChoice[Range[10, 80, 20]], ri + 99], 
                      Accumulate[RandomReal[{-1, 1}, 100]]}], {6}]; 

llps = (i = 1; ListLinePlot[#, BaseStyle -> Thick, AxesOrigin -> {0, 0}, ImageSize -> 300, 
                 PlotStyle -> ColorData[63, "ColorList"][[i++]]] & /@ dt);

Row[llps, Spacer[5]]

enter image description here

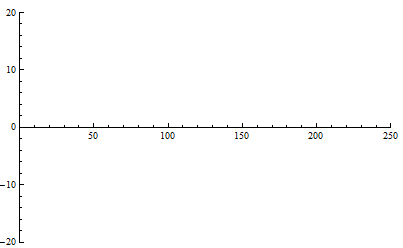
how to make an empty(ish) plot that allows me modify the range and domain to the values I need

emptyllpF = ListLinePlot[{1}, PlotRange -> #, PlotStyle -> None, 
                  BaseStyle -> Thick, AxesOrigin -> {0, 0}, ImageSize -> 400] &;
emptyllpF@{{0, 250}, {-20, 20}}

enter image description here

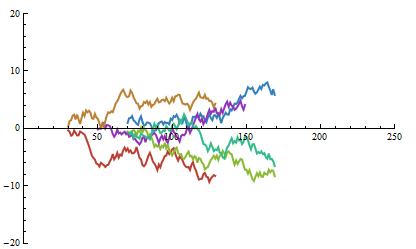
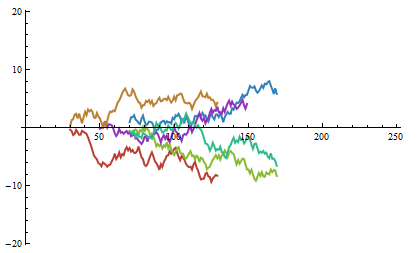
Prepend the empty plot to the list of plots and use with Show:

Show[Prepend[llps, emptyllpF@{{0, 250}, {-20, 20}}]]

enter image description here

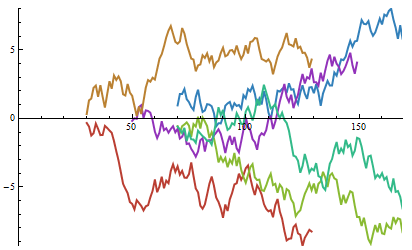
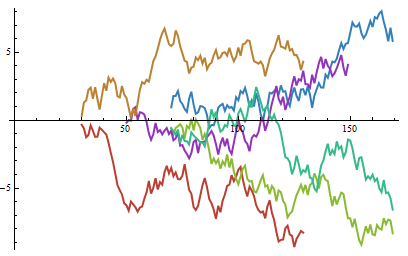
Or use a PlotRange that covers the ranges of all plots:

prange = (Through@{Min, Max}@#) & /@ (Transpose[PlotRange /@ llps])
(* {{0., 169.}, {-9.32038, 8.01998}} *)

Show[Prepend[llps, emptyllpF@prange]]

enter image description here

I tried the PlotRange-> options(All, Full and Automatic) but ...

Show[..., PlotRange->All] should work.

Show[llps, PlotRange -> All, ImageSize -> 400]

enter image description here

You can also set the PlotRange explicitly:

Example 1: Use {{0, 250}, {-20, 20}} as the setting for PlotRange:

Show[llps, PlotRange -> {{0, 250}, {-20, 20}}, ImageSize -> 400]

enter image description here

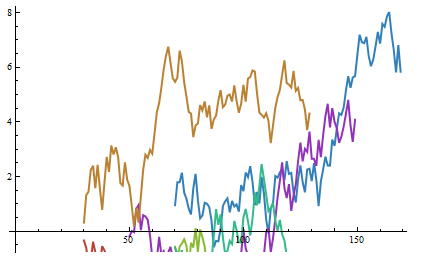
Example 2: Use the PlotRange setting of the second plot for the overlayed plots:

Show[llps, PlotRange -> PlotRange[llps[[2]]], ImageSize -> 400]

enter image description here

Example 3: Use a PlotRange that covers the ranges of all plots:

Show[llps, PlotRange -> prange, ImageSize -> 400]

enter image description here

$\endgroup$
3
  • $\begingroup$ Thank you!! Your emptyllpF graph looks very promising, it certainly is better than my latest idea to plot 4 points such that it makes a square around the area I want to view and have that as my first image in the list I use the Show function on. $\endgroup$
    – BrightHalo
    Commented Dec 4, 2014 at 17:07
  • $\begingroup$ @BrightHalo, glad you found it useful. Still think PlotRange->All is much easier. How come it doesn't work in your use cases? Btw, welcome to mma.se. $\endgroup$
    – kglr
    Commented Dec 4, 2014 at 17:11
  • $\begingroup$ Thank you so much! This was the last thing I needed before being able to finish a function that plots fractals. The PlotRange-> All wasn't working because the first graph is a line from {0,0} to {1,0} and Mathematica auto sets the viewing range based on seeing that line(even with PlotRange->All) and the Show function uses the viewing range of the first graph you give it. So even if the second graph is a line from {1,0} to {10000,0} the Show function will use the viewing range optimized to see the line from {0,0} to {1,0}. $\endgroup$
    – BrightHalo
    Commented Dec 5, 2014 at 7:17

Your Answer

By clicking “Post Your Answer”, you agree to our terms of service and acknowledge you have read our privacy policy.

Not the answer you're looking for? Browse other questions tagged or ask your own question.