Added Images
Source Link

I hobbled together a For loop to create a series ListLinePlots and appended them to a list to display them with the Show function.

My problem is I have no control over the images viewable domain and range because I can't seem to modify the viewing range and domain of a ListLinePlot image.

I tried the PlotRange-> options(All, Full and Automatic) but Show only takes into account the viewing range and domain of the first image so I can't see that being a fix.

My current idea is to create a plot with the viewable domain and range I want and have it as the first element in the list I use Show on but I can't seem to think how to make an empty(ish) plot that allows me modify the range and domain to the values I need. Does any one have any suggestions of an non-intrusive graph to plot that would work?

Thank you in advanced for any help, Bright
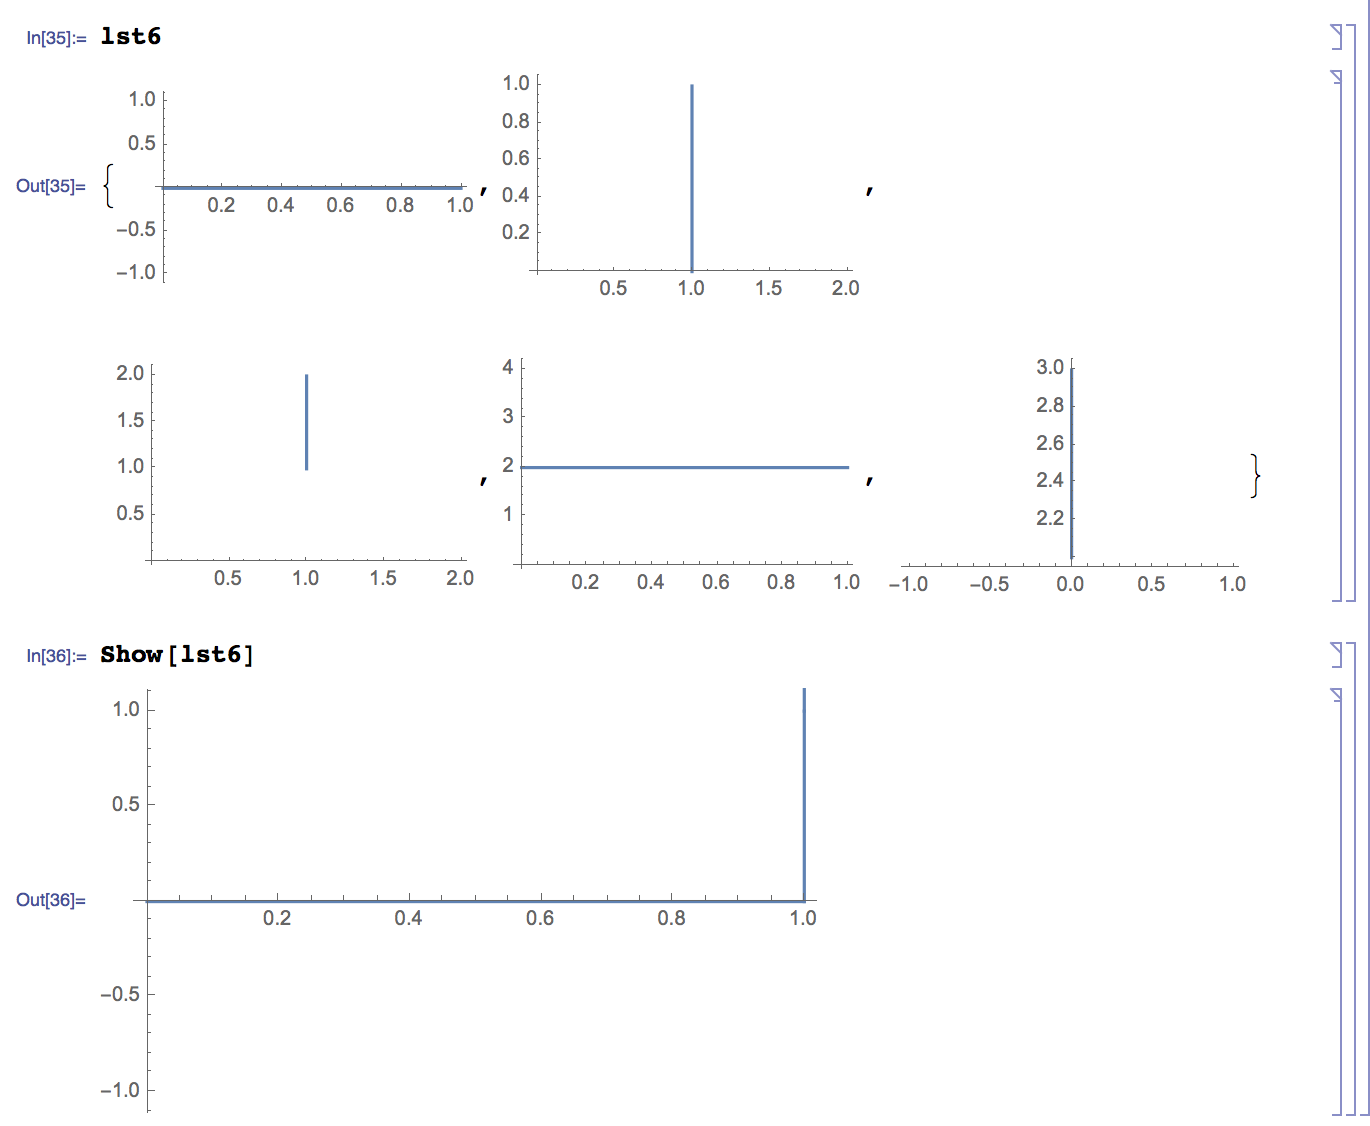
The List of Images and Current Show Output

I hobbled together a For loop to create a series ListLinePlots and appended them to a list to display them with the Show function.

My problem is I have no control over the images viewable domain and range because I can't seem to modify the viewing range and domain of a ListLinePlot image.

I tried the PlotRange-> options(All, Full and Automatic) but Show only takes into account the viewing range and domain of the first image so I can't see that being a fix.

My current idea is to create a plot with the viewable domain and range I want and have it as the first element in the list I use Show on but I can't seem to think how to make an empty(ish) plot that allows me modify the range and domain to the values I need. Does any one have any suggestions of an non-intrusive graph to plot that would work?

Thank you in advanced for any help, Bright

The List of Images and Current Show Output

Source Link

How to Create an Empty(ish) Graph to Overlay Graphs on using Show?

I hobbled together a For loop to create a series ListLinePlots and appended them to a list to display them with the Show function.

My problem is I have no control over the images viewable domain and range because I can't seem to modify the viewing range and domain of a ListLinePlot image.

I tried the PlotRange-> options(All, Full and Automatic) but Show only takes into account the viewing range and domain of the first image so I can't see that being a fix.

My current idea is to create a plot with the viewable domain and range I want and have it as the first element in the list I use Show on but I can't seem to think how to make an empty(ish) plot that allows me modify the range and domain to the values I need. Does any one have any suggestions of an non-intrusive graph to plot that would work?

Thank you in advanced for any help, Bright