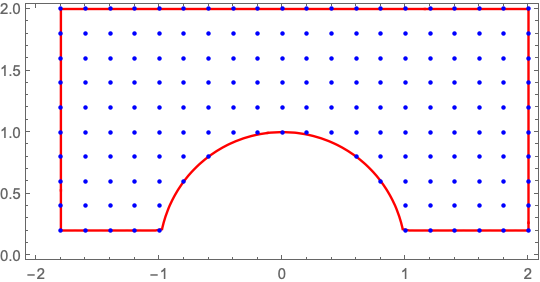
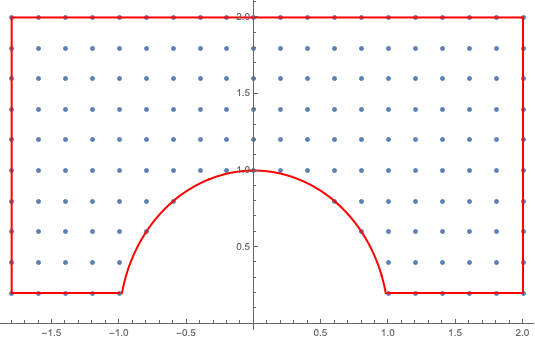
I have the following data;
pnts = {{-1.8, 0.2}, {-1.8, 0.4}, {-1.8, 0.6}, {-1.8, 0.8}, {-1.8,
1.}, {-1.8, 1.2}, {-1.8, 1.4}, {-1.8, 1.6}, {-1.8, 1.8}, {-1.8,
2.}, {-1.6, 0.2}, {-1.6, 0.4}, {-1.6, 0.6}, {-1.6, 0.8}, {-1.6,
1.}, {-1.6, 1.2}, {-1.6, 1.4}, {-1.6, 1.6}, {-1.6, 1.8}, {-1.6,
2.}, {-1.4, 0.2}, {-1.4, 0.4}, {-1.4, 0.6}, {-1.4, 0.8}, {-1.4,
1.}, {-1.4, 1.2}, {-1.4, 1.4}, {-1.4, 1.6}, {-1.4, 1.8}, {-1.4,
2.}, {-1.2, 0.2}, {-1.2, 0.4}, {-1.2, 0.6}, {-1.2, 0.8}, {-1.2,
1.}, {-1.2, 1.2}, {-1.2, 1.4}, {-1.2, 1.6}, {-1.2, 1.8}, {-1.2,
2.}, {-1., 0.2}, {-1., 0.4}, {-1., 0.6}, {-1., 0.8}, {-1.,
1.}, {-1., 1.2}, {-1., 1.4}, {-1., 1.6}, {-1., 1.8}, {-1.,
2.}, {-0.8, 0.2}, {-0.8, 0.4}, {-0.8, 0.6}, {-0.8, 0.8}, {-0.8,
1.}, {-0.8, 1.2}, {-0.8, 1.4}, {-0.8, 1.6}, {-0.8, 1.8}, {-0.8,
2.}, {-0.6, 0.2}, {-0.6, 0.4}, {-0.6, 0.6}, {-0.6, 0.8}, {-0.6,
1.}, {-0.6, 1.2}, {-0.6, 1.4}, {-0.6, 1.6}, {-0.6, 1.8}, {-0.6,
2.}, {-0.4, 0.2}, {-0.4, 0.4}, {-0.4, 0.6}, {-0.4, 0.8}, {-0.4,
1.}, {-0.4, 1.2}, {-0.4, 1.4}, {-0.4, 1.6}, {-0.4, 1.8}, {-0.4,
2.}, {-0.2, 0.2}, {-0.2, 0.4}, {-0.2, 0.6}, {-0.2, 0.8}, {-0.2,
1.}, {-0.2, 1.2}, {-0.2, 1.4}, {-0.2, 1.6}, {-0.2, 1.8}, {-0.2,
2.}, {0., 0.2}, {0., 0.4}, {0., 0.6}, {0., 0.8}, {0., 1.}, {0.,
1.2}, {0., 1.4}, {0., 1.6}, {0., 1.8}, {0., 2.}, {0.2, 0.2}, {0.2,
 0.4}, {0.2, 0.6}, {0.2, 0.8}, {0.2, 1.}, {0.2, 1.2}, {0.2,
1.4}, {0.2, 1.6}, {0.2, 1.8}, {0.2, 2.}, {0.4, 0.2}, {0.4,
0.4}, {0.4, 0.6}, {0.4, 0.8}, {0.4, 1.}, {0.4, 1.2}, {0.4,
1.4}, {0.4, 1.6}, {0.4, 1.8}, {0.4, 2.}, {0.6, 0.2}, {0.6,
0.4}, {0.6, 0.6}, {0.6, 0.8}, {0.6, 1.}, {0.6, 1.2}, {0.6,
1.4}, {0.6, 1.6}, {0.6, 1.8}, {0.6, 2.}, {0.8, 0.2}, {0.8,
0.4}, {0.8, 0.6}, {0.8, 0.8}, {0.8, 1.}, {0.8, 1.2}, {0.8,
1.4}, {0.8, 1.6}, {0.8, 1.8}, {0.8, 2.}, {1., 0.2}, {1.,
0.4}, {1., 0.6}, {1., 0.8}, {1., 1.}, {1., 1.2}, {1., 1.4}, {1.,
1.6}, {1., 1.8}, {1., 2.}, {1.2, 0.2}, {1.2, 0.4}, {1.2,
0.6}, {1.2, 0.8}, {1.2, 1.}, {1.2, 1.2}, {1.2, 1.4}, {1.2,
1.6}, {1.2, 1.8}, {1.2, 2.}, {1.4, 0.2}, {1.4, 0.4}, {1.4,
0.6}, {1.4, 0.8}, {1.4, 1.}, {1.4, 1.2}, {1.4, 1.4}, {1.4,
1.6}, {1.4, 1.8}, {1.4, 2.}, {1.6, 0.2}, {1.6, 0.4}, {1.6,
0.6}, {1.6, 0.8}, {1.6, 1.}, {1.6, 1.2}, {1.6, 1.4}, {1.6,
1.6}, {1.6, 1.8}, {1.6, 2.}, {1.8, 0.2}, {1.8, 0.4}, {1.8,
0.6}, {1.8, 0.8}, {1.8, 1.}, {1.8, 1.2}, {1.8, 1.4}, {1.8,
1.6}, {1.8, 1.8}, {1.8, 2.}, {2., 0.2}, {2., 0.4}, {2., 0.6}, {2.,
 0.8}, {2., 1.}, {2., 1.2}, {2., 1.4}, {2., 1.6}, {2., 1.8}, {2.,
2.}};
newpnts = Select[pnts, ! #[[1]]^2 + #[[2]]^2 < 1 &];
ListPlot[newpnts];
The graph of newpnts is essentially a uniform spread of points with increment .2, that has had points excluded where x^2+y^2<1. I wanted to know if there was an easy way to get mathematica to connect the boundary points for me. Essentially it would be creating 4 line segments and a semi circle. Is the only way to do this to create functions for each segment? If so how do I lay all 5 functions on the same plot?


