1
$\begingroup$

I want to treat the output of a plot (DensityPlot specifically) as a single graphics object and reduce its opacity. Something like:

DensityPlot[x^2 - y^2, {x, -1, 1}, {y, -1, 1}, ColorFunction -> 
"SunsetColors", Frame -> False,MeshFunctions -> {#3 &, #3 &}, 
Mesh -> 10] //  Graphics[#, Opacity[.1]] &

except this actually doesn't work...

$\endgroup$
8
  • 1
    $\begingroup$ If the DensityPlot is called plot, then: plot /. Graphics[a_, b___] :> Graphics[{Opacity[0.1], a}, b]. $\endgroup$
    – march
    Commented Jun 30, 2016 at 23:00
  • 3
    $\begingroup$ Actually, even better: DensityPlot[x^2 - y^2, {x, -1, 1}, {y, -1, 1}, ColorFunction -> "SunsetColors", Frame -> False, BaseStyle -> Opacity[0.1]] $\endgroup$
    – march
    Commented Jun 30, 2016 at 23:03
  • 1
    $\begingroup$ What is the intended application? Do you mean you want the output to have Head of Graphics, or be a graphics object of the kind that goes inside a Graphics? $\endgroup$
    – Jens
    Commented Jun 30, 2016 at 23:38
  • $\begingroup$ g1 = DensityPlot... g1 /. Graphics[a_, b___] :> Graphics[{Opacity[0.1], a}, b] This didn't actually change the opacity of anything... BaseStyle -> Opacity[0.1] This helped---it did change the opacity of the colored patches but doesn't change the opacity of the mesh. (I forgot to include the fact that I have "MeshFunctions -> {#3 &, #3 &}, Mesh -> 10" included in my Options for Density plot, so it looks a lot like a ContourPlot.) $\endgroup$
    – glwhart
    Commented Jul 1, 2016 at 1:07
  • 1
    $\begingroup$ If the plot is produced as described, plot/. GrayLevel[__] -> Opacity[n] where plot, n are symbol of plot and desired opacity is a QND way to get it done. $\endgroup$
    – ciao
    Commented Jul 1, 2016 at 4:31

2 Answers 2

7
$\begingroup$

The problem is that the plot already included Opacity directives when mesh lines are drawn, so that one would have to change their opacity using a replacement rule, separately from the opacity of the gradient.

Instead, I would suggest achieving the same effect by just putting a blank Inset on top of your plots, with an opacity that varies in the opposite direction as what you want to see of you plot:

d = DensityPlot[x^2 - y^2, {x, -1, 1}, {y, -1, 1}, 
   ColorFunction -> "SunsetColors", Frame -> False, 
   MeshFunctions -> {#3 &, #3 &}, Mesh -> 10, ImageSize -> 200, 
   AspectRatio -> 1];

With[{bgColor = White},
 GraphicsGrid[Table[
    Show[d, 
     Epilog -> 
      Inset["", Automatic, Automatic, Scaled[1], 
       Background -> Directive[Opacity[i], bgColor]]], {i, 0, 1, .1}]~
   Partition~2]]
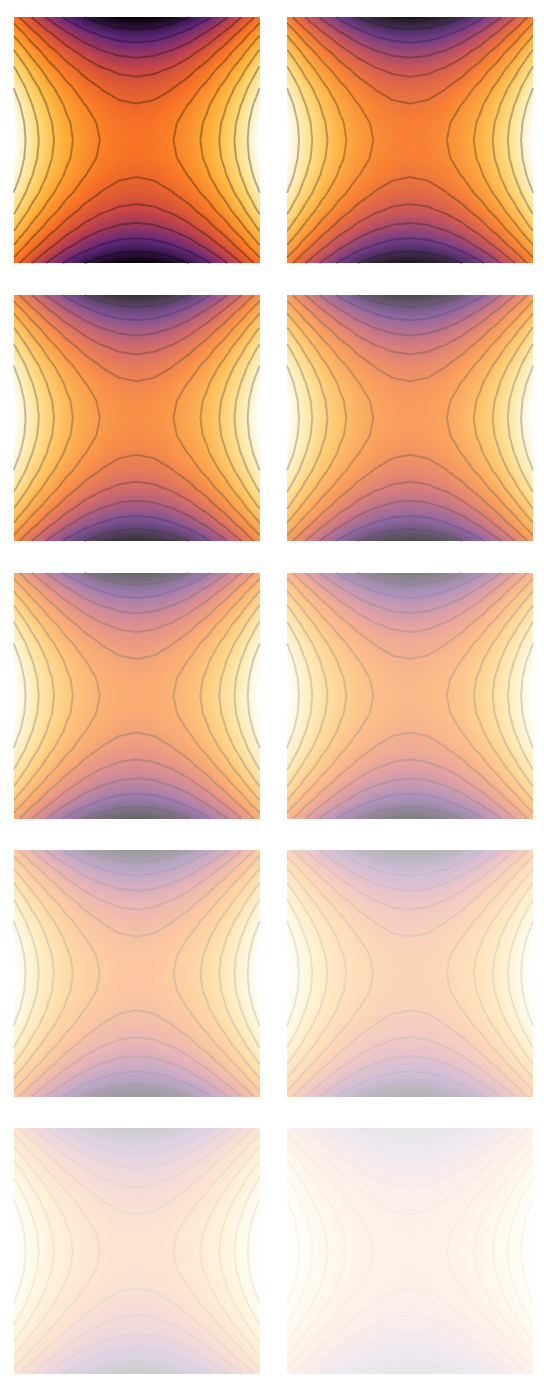
opacity

Here, I gave the Inset a background of the same color as the paper (White). The last argument of Inset is used to expand it to the size of the enclosing plot. For more control, I also decided to add ImageSize and AspectRatio specifications to the plot d.

$\endgroup$
3
  • $\begingroup$ I suppose there'll be some side effect? when you overlap a image with opacity over another, the other image will show up, while in your solution, it won't. Are there anyway to solve this problem? still, a great answer! $\endgroup$
    – Wjx
    Commented Jul 1, 2016 at 8:43
  • $\begingroup$ Jens, this a great answer. I still wish there was a way to "convert" the whole plot, mesh lines and all, to a graphics object of some sort. That way I could control the opacity just like it was a Circle[], or Rectangle[]. I'm making 16 of this as little thumbnails for use in a GraphicsRow. Wish I could alter them the same way that I can alter a graphics primitive. $\endgroup$
    – glwhart
    Commented Jul 1, 2016 at 13:50
  • $\begingroup$ I suppose one could export the plot as a image, import it, and then change the opacity via BaseStyle: g = Import["ExampleData/rose.gif"] Show[g, BaseStyle -> Opacity[.1]] Maybe there's a way to convert it to an image without exporting it first... (Sorry I can figure out how to format comments. My code is all squashed together and not highlighted like code...) $\endgroup$
    – glwhart
    Commented Jul 1, 2016 at 13:57
1
$\begingroup$

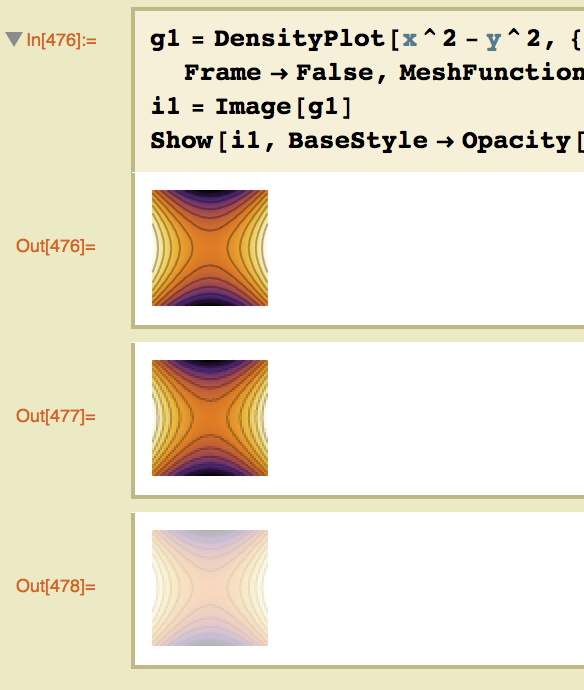
OK, this solution is less sophisticated than Jens' answer and some of the suggestions in the comments, but maybe it will be of use to someone else. I want to treat the entire plot (frame, legends, everything, if they exist) as single entity and adjust its opacity. So I turn it all into an image first and then adjust the opacity of the image. Brute force, but maybe a good solution for my context.

g1 = DensityPlot[x^2 - y^2, {x, -1, 1}, {y, -1, 1}, ColorFunction ->,
"SunsetColors", Frame -> False, MeshFunctions -> {#3 &, #3 &}, Mesh -> 10]
i1 = Image[g1]
Show[i1, BaseStyle -> Opacity[.3]]

enter image description here

$\endgroup$
2
  • 2
    $\begingroup$ If you really must: SetAlphaChannel[Rasterize[g1], 0.3]. $\endgroup$ Commented Jul 1, 2016 at 14:22
  • $\begingroup$ @ J.M. Even better. Thanks $\endgroup$
    – glwhart
    Commented Jul 1, 2016 at 14:37

Your Answer

By clicking “Post Your Answer”, you agree to our terms of service and acknowledge you have read our privacy policy.

Not the answer you're looking for? Browse other questions tagged or ask your own question.