3
$\begingroup$

I get the basic idea of using ImageCompose[], but I seem to be missing something, making me wonder if there's a better way.

The first thing that's a little confusing is that if I make a graphics object, apparently neither the size nor position I give to Graphics has any effect on where the Graphics object ends up in the image when I use ImageCompose:

img = Import["ExampleData/lena.tif"]
ImageDimensions@img

a = Graphics[{Green, Disk[{5, 5}, .1]}];
ImageCompose[img, a]

enter image description here

though I guess that kind of makes sense because it's relative. So I know I can used scaled, like so:

img = Import["ExampleData/lena.tif"]
imgdim = ImageDimensions@img

a = Graphics[{Green, Disk[{5, 5}, .1]}, ImageSize -> First@imgdim/10];
b = Graphics[{Green, Disk[{5, 5}, .1]}, ImageSize -> First@imgdim/10];
ImageCompose[img, {a, b}, {Scaled[{0, 0}], Scaled[{1, 1}]}]

enter image description here

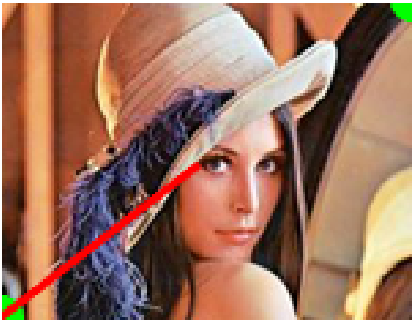
But I get a little confused when I want to put a line on the image. I can't figure out a way of doing it that doesn't involve creating the line and then awkwardly scaling it, something like:

img = Import["ExampleData/lena.tif"];
imgdim = ImageDimensions@img

a = Graphics[{Green, Disk[{5, 5}, .1]}, ImageSize -> First@imgdim/8];
b = Graphics[{Green, Disk[{5, 5}, .1]}, ImageSize -> First@imgdim/8];
c = Graphics[{Red, [email protected], Line[{{0, 0}, imgdim}]}, 
   ImageSize -> First@imgdim];
ImageCompose[img, {a, b, c}, {Scaled[{0, 0}], Scaled[{1, 1}], 
  Scaled[{0, 0}]}]

enter image description here

(to be honest, I don't even fully get what's going on here, since it seems like I made the Line c the same size as the Lena image, but it only goes halfway across...)

Anyway, is there a less awkward way of doing this? I thought maybe Epilog would be the way but I can't see where I'd put it... I'd like to just be able to use the same coordinates as the image and directly plot Graphics[] objects onto the image. How can I do this?


$\endgroup$
1

1 Answer 1

2
$\begingroup$

A good way is to use Inset that you can use to include your image in a Graphics. If you set up the coordinates correctly, you should get correct results.

Everything depends on how you define pixel position meaning if the center of your pixels is on half steps or if you want to have the center on integer positions, but you can adjust this as you like. Let me give a small demo with an 20x20 image:

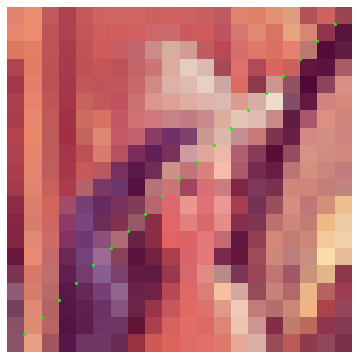
img = ImageResize[ExampleData[{"TestImage", "Lena"}], {20, 20}];
{nx, ny} = ImageDimensions[img];

Graphics[{
  Inset[img, {1, 1}, {1, 1}, {nx, ny}],
  White, Line[{{2, 2}, {nx - 1, ny - 1}}],
  Green,
  Point[{14.5, 10.5}]
  }, PlotRange -> {{1, nx}, {1, ny}}]

Mathematica graphics

Edit

Long time ago, when Image was in the distant future, the method of displaying pixel data was using Raster. This of course still works and both Inset and Raster will produce a RasterBox in the output expression. Remember that image coordinates have a reversed y-axis and if you use Raster you need to take care of that:

Graphics[{Raster[Reverse@ImageData[img]], White, Green, 
  Table[Point[{i, i}], {i, 1, nx - 1}]}]

Mathematica graphics

$\endgroup$
8
  • $\begingroup$ Inset isn't necessary: "Raster[array,{{xmin,ymin},{xmax,ymax}}] specifies that the raster should be taken to fill the rectangle Rectangle[{xmin,ymin},{xmax,ymax}] >>." Probably it is also more efficient. $\endgroup$ Commented Jul 12, 2017 at 5:30
  • $\begingroup$ AFAIK, Raster is the very old implementation of representing images in Mathematica. We used it for years in image processing to display results. I will edit my answer. The reason for suggesting Inset is that it has greater flexibility and if you look at the output expression, you'll find that both Inset and Raster produce a RasterBox. $\endgroup$
    – halirutan
    Commented Jul 12, 2017 at 14:04
  • $\begingroup$ Why not HighlightImage? $\endgroup$
    – Batracos
    Commented Jul 12, 2017 at 14:07
  • 1
    $\begingroup$ @halirutan please give it another try! I spent a reasonable amount of time to take it over and refactor it completely to avoid rasterization whenever possible. HighlightImage[img, {Opacity[1], Green, Disk[{0, 0}, 20], Disk[imgdim, 20], Red, Line[{{0, 0}, imgdim}]}] $\endgroup$
    – Batracos
    Commented Jul 13, 2017 at 17:00
  • 1
    $\begingroup$ Also, to go from image to Graphics you may want to use Image`ToGraphicsRaster $\endgroup$
    – Batracos
    Commented Jul 13, 2017 at 17:07

Your Answer

By clicking “Post Your Answer”, you agree to our terms of service and acknowledge you have read our privacy policy.

Not the answer you're looking for? Browse other questions tagged or ask your own question.