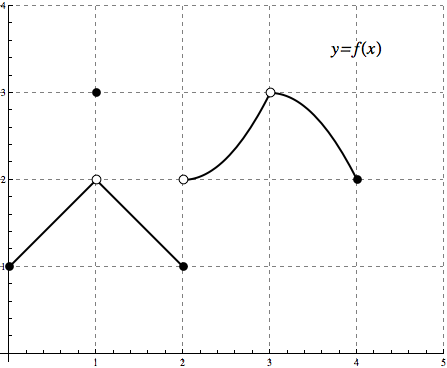
I'm trying to replicate a graph from my math book for my notes as well as to learn Mathematica. I was hoping someone would be able to help me figure out how to add the open points to the graph, and possibly add a slight curve to the lines as shown in the real graph. My lines are straight.
The Graph from the book:

What I've been able to come up with:
   g[x_] := \[Piecewise] {
   {x + 1, x < 1},
   {-x + 3, x < 2},
   {(x + 2) - 2, x < 3},
   {-x + 6, x < 4}
  }

Plot[g[x], {x, 0, 5},
 PlotStyle -> {Thick}, PlotRange -> {0, 5},
 Ticks -> {{0, 1, 2, 3, 4, 5}, {0, 1, 2, 3, 4, 5}, Automatic},
 GridLines -> {{0, 1, 2, 3, 4, 5}, {0, 1, 2, 3, 4, 5}},
 GridLinesStyle -> Directive[LightGray, Dashed],
 Epilog -> {Red, Dashed, PointSize[Large],
   Point[{{0, 1}, {1, 3}, {2, 1}, {4, 2}}]
   }
 ]


Epilog -> {Red, Dashed, PointSize[Large], Point[{{0, 1}, {1, 3}, {2, 1}, {4, 2}}], White, PointSize[Medium], Point[{{0, 1}, {1, 3}, {2, 1}, {4, 2}}]}$\endgroup$