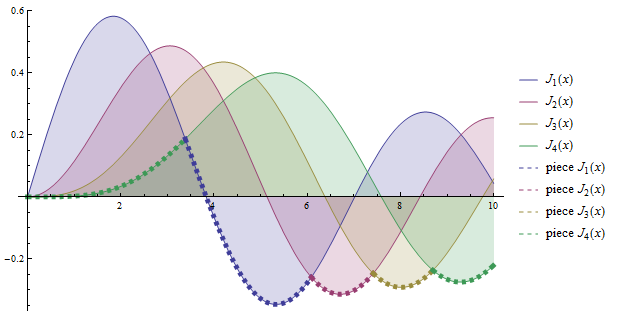
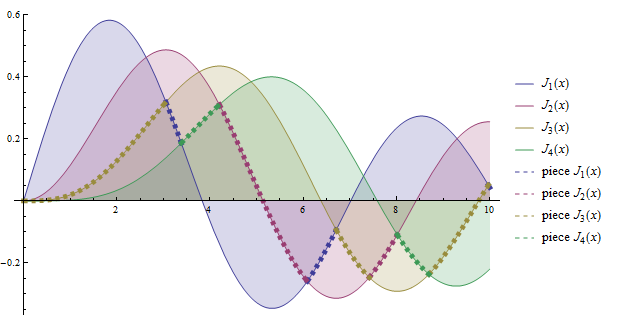
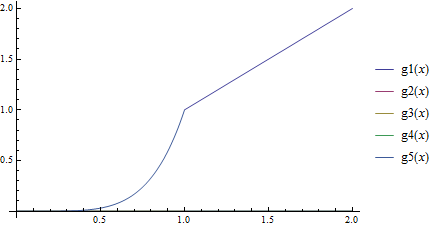
This is my first question on any stack-exchange site and I'm also very new to using Mathematica software so please excuse/correct me if I mess up.
I would like to take a list of functions of a single variable {$f_1, f_2, f_3, \ldots, f_n$}, and plot the minimum value that each of these functions takes on at any point over an interval $[x_0, x_f]$.
So far this much is not so difficult (or has not been the difficult part for me to figure out). However, I would like for each of the intervals over which any function $f_i$ is the minimum to correspond to it's own color (like how Plot usually attributes different colors to different curves when you plot multiple functions) and further I'd like to include a legend that clearly denotes which function from the list corresponds to which color.
I can do the first part fairly easily using the following:
Z[x_] = Min[x, x^2, x^3, x^4, x^5]
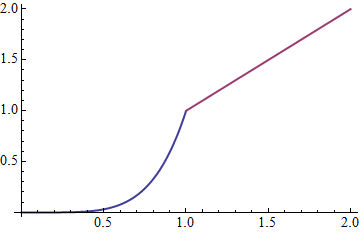
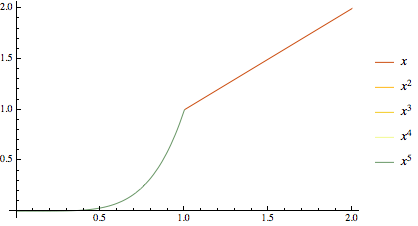
Plot[Z[x], {x, 0, 2}, PlotLegends -> "Expressions"]
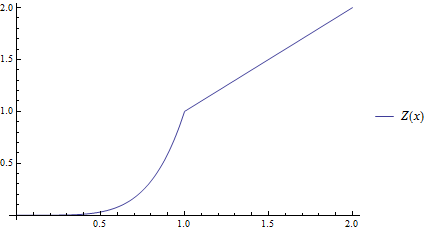
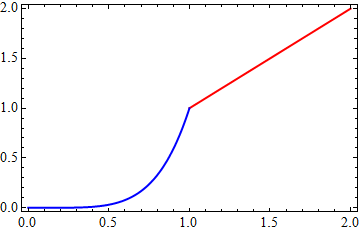
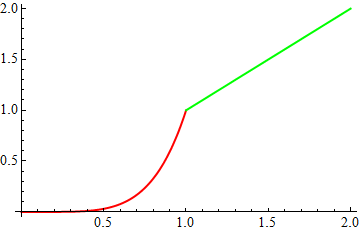
I would like something that would color the segment of the curve where $x^5$ is the minimum function in the list one color and the segment where $x$ is the minimum function in another color and denote the color representations on the legend on the right.
I can plot each of the functions separately with the color-coding system like so:
Plot[{x, x^2, x^3, x^4, x^5}, {x, 0, 2}, PlotLegends -> "Expressions"]
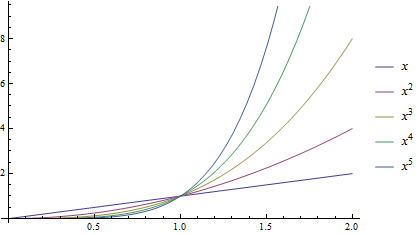
And in both cases the " PlotLegends -> "Expressions" " flag/option (not sure what the terminology is for Mathematica functions) does nicely generate a legend as I'd like it.
But I don't really have a sense of how to combine the two.
Thanks in advance for the help, and while I didn't find any other questions that might help answer (or partially answer) this question please correct me if I missed any.

