8
$\begingroup$

Let's say I am plotting

Plot[{Sin[x], Cos[x]}, {x, 0, 2 π}, PlotStyle -> {Thickness[0.01], Thickness[0.01]}]

I want to keep the same colors for the two functions — $\sin(x)$ and $\cos(x)$ — but want to increase the thickness of the minimum of two functions for each value of $x$. What is the easiest way to do that?

Edit

I want to clarify what I meant. Let's say the colors of the two functions f1 and f2 are blue and red and thickness for both functions is 0.01. Now for each x, I just want to increase the thickness of the function $min(f1, f2)$ in the same plot while keeping the blue and red colors separately for f1 and f2.

$\endgroup$
7
  • $\begingroup$ Do you mean you want varying thickness along the curve, depending on which curve is on top? $\endgroup$ Commented Jul 26, 2017 at 12:43
  • $\begingroup$ Thies, yes, exactly. $\endgroup$
    – cleanplay
    Commented Jul 26, 2017 at 12:50
  • $\begingroup$ You could either achieve this by calling Plot[{Min[f1[x],f2[x]],Max[f1[x],f2[x]]}] and giving it different PlotStyles or by cutting the curves in segments where they cross and giving them individual PlotStyles. $\endgroup$ Commented Jul 26, 2017 at 12:51
  • 1
    $\begingroup$ possible duplicate: Plot the minimum of a list of functions $\endgroup$
    – kglr
    Commented Jul 26, 2017 at 13:47
  • 1
    $\begingroup$ @Mr.Wizard, this answer in the linked q/a works for this case too. $\endgroup$
    – kglr
    Commented Jul 26, 2017 at 14:07

5 Answers 5

7
$\begingroup$

Perhaps this is what you are looking for.

minSin[x_] /; Sin[x] < Cos[x] := Sin[x]
minCos[x_] /; Sin[x] > Cos[x] := Cos[x]
maxSin[x_] /; Sin[x] > Cos[x] := Sin[x]
maxCos[x_] /; Sin[x] < Cos[x] := Cos[x]

Plot[{minSin[x], maxSin[x], minCos[x], maxCos[x]}, {x, 0, 2 π},
  PlotStyle ->
    {{Blue, Thickness[0.02]}, {Blue, Thickness[0.01]},
     {Red, Thickness[0.02]}, {Red, Thickness[0.01]}}]

plot

$\endgroup$
9
$\begingroup$

Choose two colors:

{c1,c2}={ColorData[97, 1], ColorData[97, 2]}

Define a custom color function:

myColorFunction[x_] := If[Cos[x] > Sin[x], c1,c2]

Generate two plots (because you can't specify two different color functions in the same plot) and combine them:

g1 = Plot[{Sin[x], Cos[x]}, {x, 0, 2 Pi}, PlotStyle -> {c1,c2}];
g2 = Plot[Min[Sin[x], Cos[x]], {x, 0, 2 Pi}, 
   PlotStyle -> Thickness[0.015], ColorFunctionScaling -> False, 
   ColorFunction -> (myColorFunction[#1] &), Exclusions -> None];
Show[g2, g1, PlotRange -> {-1,1}]

Voilà:

enter image description here

$\endgroup$
8
$\begingroup$

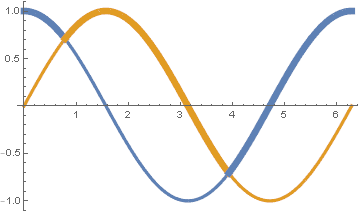
One way of doing this which works in this case would be:

Plot[Evaluate[MinMax[{#1, #2}]], {x, 0, 2 \[Pi]}, 
  PlotStyle -> {Thickness[0.01], Thickness[0.02]}, 
  ColorFunctionScaling -> False, 
  ColorFunction -> (ColorData[97][1 + Boole[Sin[#1] == #2]] &)
] &[Sin[x], Cos[x]]

Plot with two curves with varying thickness

$\endgroup$
3
  • 3
    $\begingroup$ I think this doesn't answer the OP's question - the intention was to keep the colors but vary the thickness. $\endgroup$
    – yohbs
    Commented Jul 26, 2017 at 13:31
  • 1
    $\begingroup$ Fixed my answer. $\endgroup$ Commented Jul 26, 2017 at 15:23
  • 1
    $\begingroup$ That's very nice. $\endgroup$
    – Mr.Wizard
    Commented Jul 26, 2017 at 15:35
7
$\begingroup$

Modifying this answer slightly:

flist = {Sin[x], Cos[x]};
pieces = Table[ConditionalExpression[f, f == Min[flist]], {f, flist}];
pltstyls = Join[#, Directive[{#, Thickness[.007]}] & /@ #] &[
  ColorData[97, "ColorList"][[;; Length@flist]]];

Plot[Evaluate@Join[flist, pieces], {x, 0, 10}, PlotStyle -> pltstyls]

enter image description here

More generally, for arbitrary number of functions and filling:

flist = {Sin[x], Cos[x], x Sin[x]/2};
filling = Thread[Range[Length@flist] -> Axis];
pieces = Table[ConditionalExpression[f, f == Min[flist]], {f, flist}];
pltstyls = Join[#, Directive[{#, Thickness[.007]}] & /@ #] &[
  ColorData[97, "ColorList"][[;; Length@flist]]];

Plot[Evaluate@Join[flist, pieces], {x, 0, 10}, Filling -> filling, PlotStyle -> pltstyls]

enter image description here

$\endgroup$
2
  • $\begingroup$ I think the filling and the third line obfuscate this somewhat, but +1 nevertheless. $\endgroup$
    – Mr.Wizard
    Commented Jul 26, 2017 at 14:17
  • $\begingroup$ Thank you @Mr.Wizard. $\endgroup$
    – kglr
    Commented Jul 26, 2017 at 14:24
2
$\begingroup$

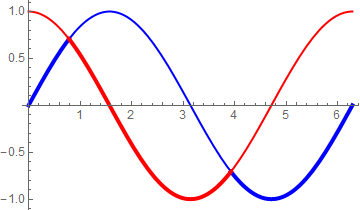
Applying a modification of my own method from Plot the minimum of a list of functions, and perhaps proving kglr's assertion that this question is a duplicate:

emph[fn_][a__] := Riffle[{a}, If[# == fn[a], #] & /@ {a}]

Plot[emph[Min][Sin[x], Cos[x]], {x, 0, 2 Pi}
 , Evaluated -> True
 , PlotStyle -> Tuples[{{Blue, Red}, AbsoluteThickness /@ {2, 4}}]
]

enter image description here

$\endgroup$

Your Answer

By clicking “Post Your Answer”, you agree to our terms of service and acknowledge you have read our privacy policy.

Not the answer you're looking for? Browse other questions tagged or ask your own question.