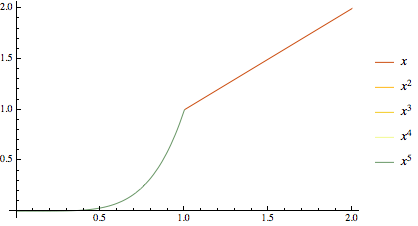
Simple solution using RegionFunction:
f[x_] := {x, x^2, x^3, x^4, x^5};
Plot[Evaluate@f[x], {x, 0, 2}, PlotLegends -> "Expressions",
 RegionFunction -> Function[{x, y}, y == Min[ys]]Min[f[x]]], PlotPoints -> 20,
 PlotRange -> All, PlotStyle -> ColorData[35, "ColorList"]]

One limitation is that you get overshooting unless you fiddle with the number of PlotPoints.
The only reason I changed the PlotStyle is because the first and fifth colours are hard to tell apart in the default colour scheme.
