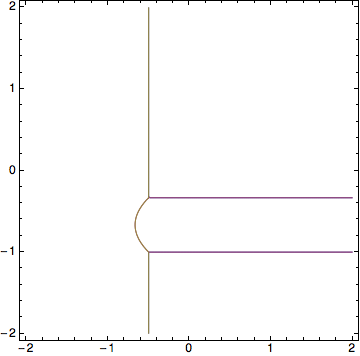
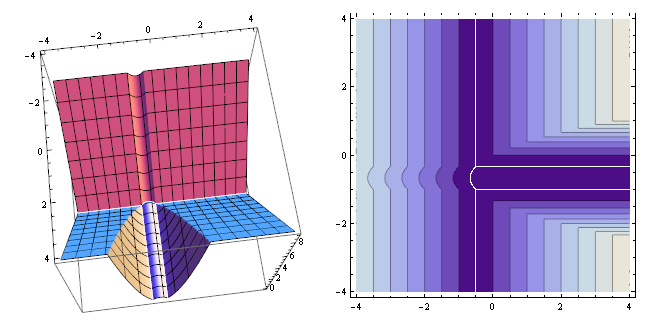
I have a list of (ten or so) functions of two variables (x and y, say). I would like to plot the boundaries on the x y plane where two functions have the same value - but only the two functions in the list which have the smallest values at that particular point. Can this be done? (The Physics application - I have a number of states with different energies (the list of functions), and I am trying to plot the different regions where different states are the ground state.)
Edit follows,
Thanks for your help. I have made some progress with this - functions are parabola. Here is my code so far.
Clear[a, x, y, m, n, p, l]
m[x_, y_] := x^2 + y^2;
n[x_, y_] := x^2 + (2 y + 1)^2;
p[x_, y_] := (x + 1)^2 + y^2;
l = {m[x, y], n[x, y], p[x, y]};
ContourPlot[l[[First[Ordering[l, 2]]]] == l[[Last[Ordering[l, 2]]]], {x,-4,4}, {y,-4,4}, PlotPoints -> 200]
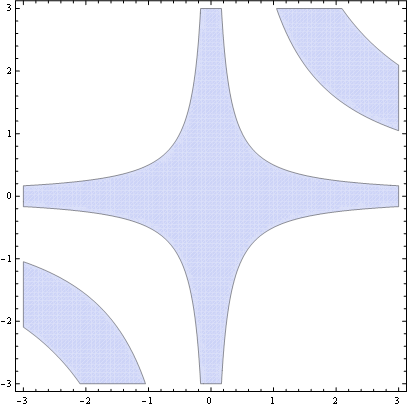
RegionPlot[l[[Last[Ordering[l, 2]]]]-l[[First[Ordering[l, 2]]]]<0.05,{x,-4,4},{y, -4, 4},PlotPoints->200]
The ContourPlot does not work - I get a blank plot - but the RegionPlot does show the regions where the lowest two functions are approximately equal. So is this something to do with the precision at which the calculation is carried out?
I did try the solution provided by Verde - thankyou very much for that - but I didn't fully understand it, and had trouble integrating it with the rest of my code.
Any further help would be much appreciated!
Nick


