0
$\begingroup$

I have to plot about 24 different predicates using RegionPlot

RegionPlot[{set1,set2,......,set24},{x,-Range,Range},{y,-Range,Range},PlotLegends->"AllExpressions",BoundaryStyle->Dashed]

where set1 through set24 are each unions of some fixed number of inequalities in $x$ and $y$.

How do I get Mathematica to choose 24 distinct colors or shading/filling for these 24 predicates, without having to assign them manually?

EDIT: How do you get the legend of the different regions to be labeled inside the regions? Previous answers on SE for similar queries focused on using coordinates, but I would like to do this automatically.

$\endgroup$
1
  • 1
    $\begingroup$ A mimimal example (minimal in the sense that you don't need to give us the full 24 predicates) would be helpful here, so that we can run the code that you give us in order to help. In addition, it would help us to determine what you need. I suspect that you need non-overlapping regions colored separately, but without the code and explanation, it's hard to figure out what you need. $\endgroup$
    – march
    Commented Dec 20, 2018 at 19:53

1 Answer 1

1
$\begingroup$

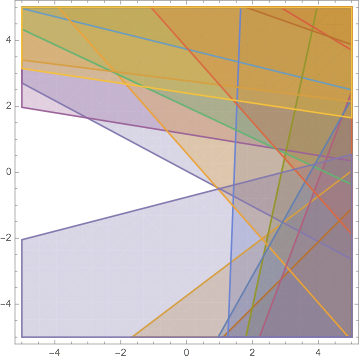
The colors are automatically distinct:

    RegionPlot[
     Evaluate@
  Table[RandomReal[] x > (-1)^i RandomReal[] y + 5 RandomReal[], 
     {i, 24}],
     {x, -5, 5}, {y, -5, 5}
     ]

enter image description here

Try also:

PlotStyle -> Table[{Opacity[0.5], Hue[i/24]}, {i, 24}]
$\endgroup$
1
  • $\begingroup$ thanks! But how do you get well-distinguishable colors, or even better, each region shaded differently so that if there are two regions with the same color, then they can be distinguished in some way? [Also: I edited my question slightly. Please have a look.] $\endgroup$ Commented Dec 21, 2018 at 18:33

Your Answer

By clicking “Post Your Answer”, you agree to our terms of service and acknowledge you have read our privacy policy.

Not the answer you're looking for? Browse other questions tagged or ask your own question.