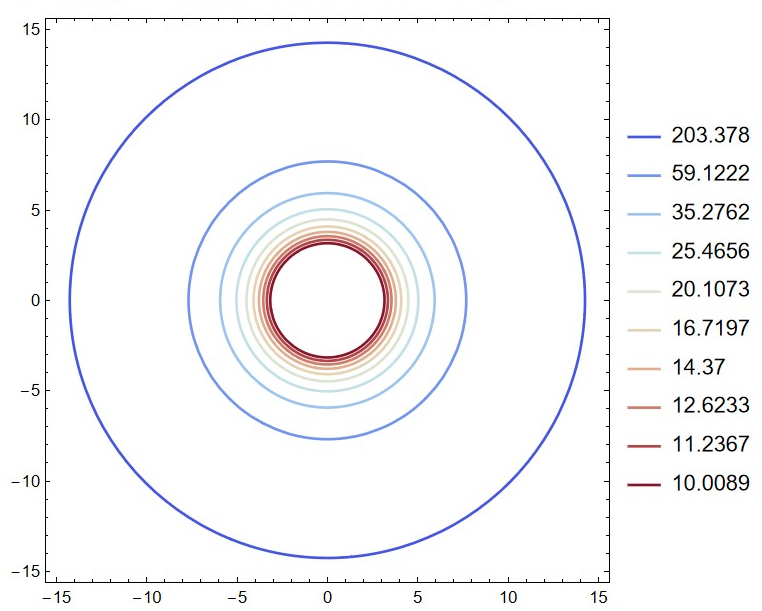
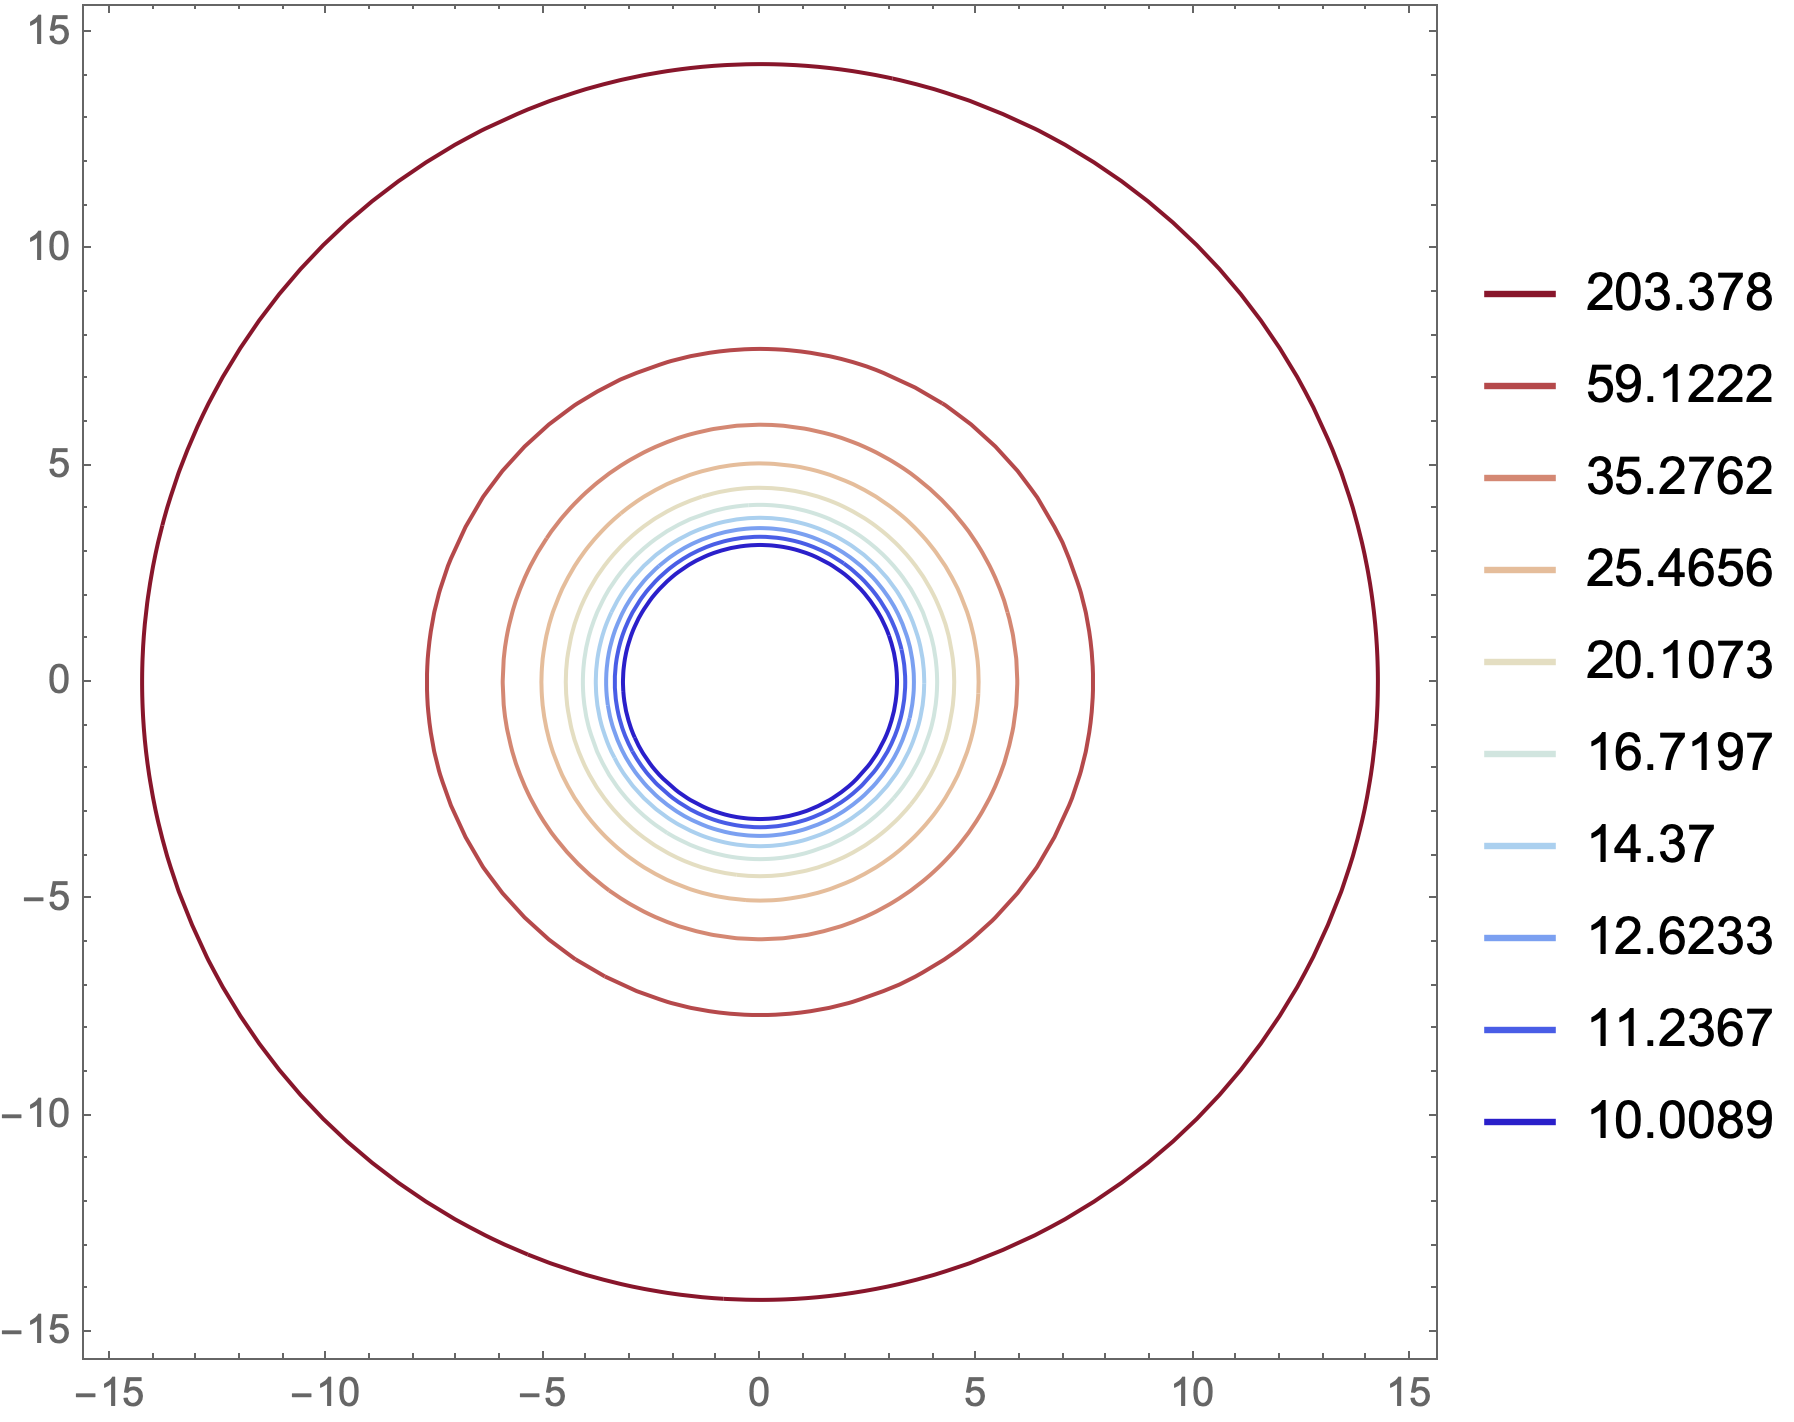
I have a problem with ContourPlot colors. In fact, i have the following table
A={x^2 + y^2 == 203.378, x^2 + y^2 == 59.1222, x^2 + y^2 == 35.2762, x^2 + y^2 == 25.4656, x^2 + y^2 == 20.1073, x^2 + y^2 == 16.7197, x^2 + y^2 == 14.37, x^2 + y^2 == 12.6233, x^2 + y^2 == 11.2367, x^2 + y^2 == 10.0089}
That i want to plot using the colors of "ThermometerColors". To do so, i used the following
ContourPlot[Evaluate@A, {x, -15, 15}, {y, -15, 15}, ColorFunction -> "ThermometerColors"]
However, all the plots have the same color. I think that ContourPlot associates only the first color to the functions of table A. Any idea how to associate one color from "ThermometerColors" to each function?


