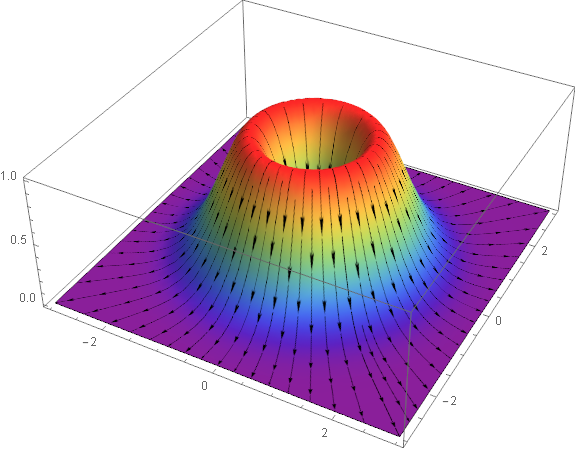
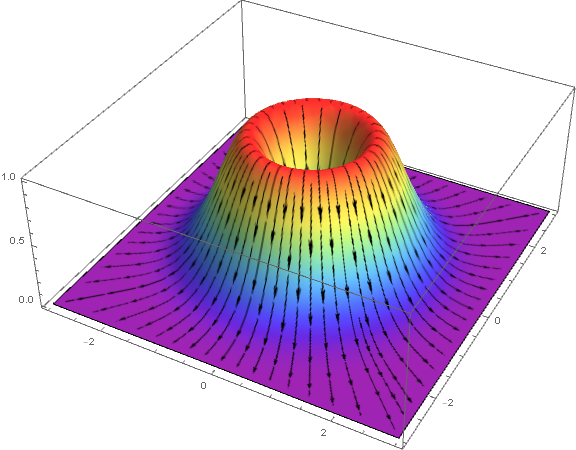
The following function generates a plot of the 3d function indicated in the example.
Plot3D[(x^2 + y^2) Exp[1 - x^2 - y^2], {x, -3, 3}, {y, -3, 3},
 Mesh -> None, ImageSize -> Large, PlotPoints -> 35,
 PlotStyle -> {Texture[
    StreamPlot[
     Evaluate[-D[(x^2 + y^2) Exp[1 - x^2 - y^2], {{x, y}}]], {x, -3,
      3}, {y, -3, 3}, Frame -> None, ImageSize -> Large,
     StreamStyle -> Black]]}]
However, when I choose a different ColorFunction parameter the texture (that only consists of arrows) disappears. Any idea how to correct this? I tried to make the background transparent, combine two 3D plots etc without success. Also, I have no idea why this is happening.
Here is the 3D plot without the gradient field.
Plot3D[(x^2 + y^2) Exp[1 - x^2 - y^2], {x, -3, 3}, {y, -3, 3},
 Mesh -> None, ImageSize -> Large, PlotPoints -> 35,
 PlotStyle -> {Texture[
    StreamPlot[
     Evaluate[-D[(x^2 + y^2) Exp[1 - x^2 - y^2], {{x, y}}]], {x, -3,
      3}, {y, -3, 3}, Frame -> None, ImageSize -> Large,
     StreamStyle -> Black]]}, ColorFunction -> "Rainbow"]


